. 2013 Jul 19;8(7):e69648.
doi: 10.1371/journal.pone.0069648. Print 2013.

i3Drefine software for protein 3D structure refinement and its assessment in CASP10

Affiliations

i3Drefine software for protein 3D structure refinement and its assessment in CASP10

Debswapna Bhattacharya et al. PLoS One. .

Abstract

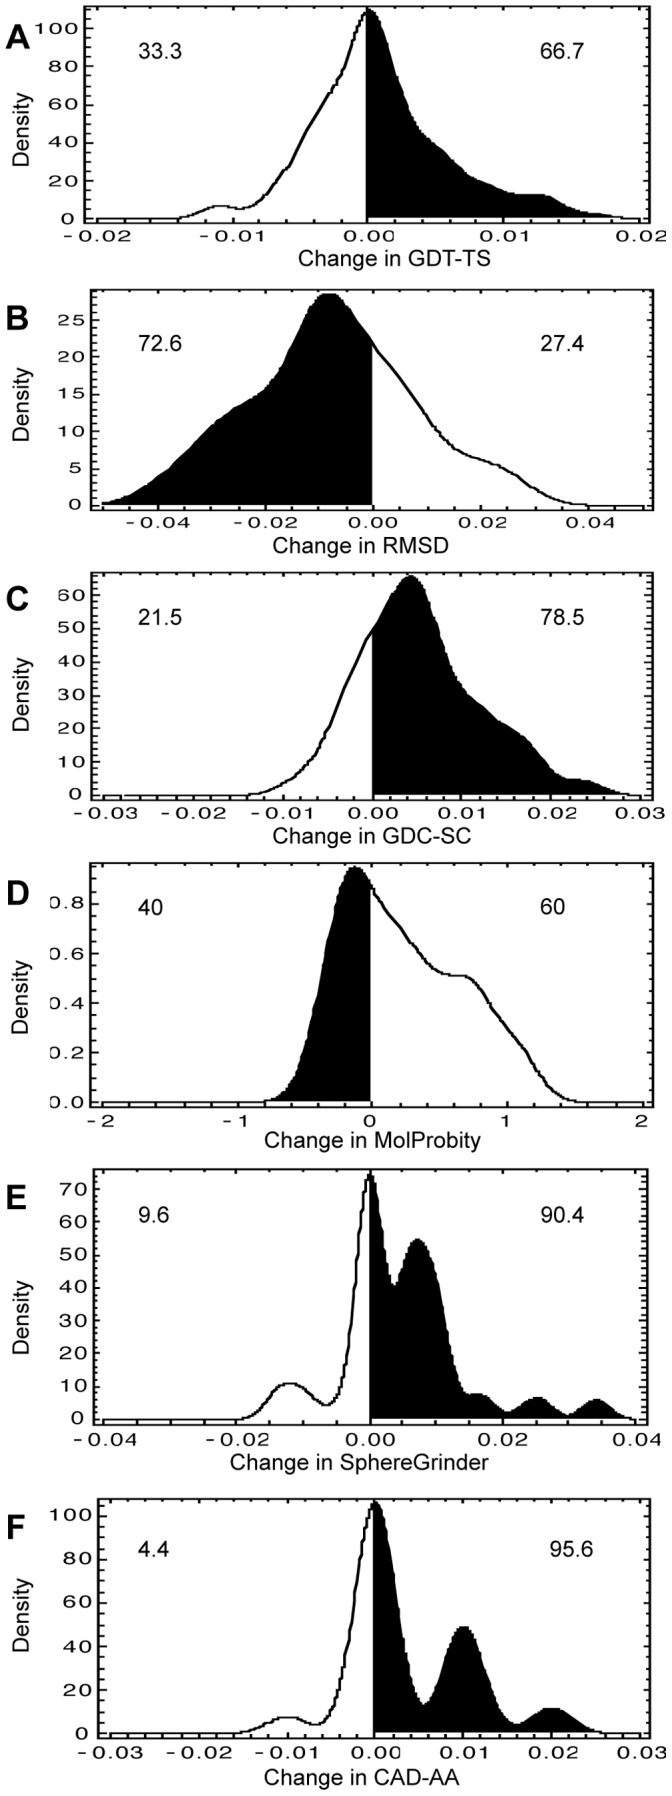
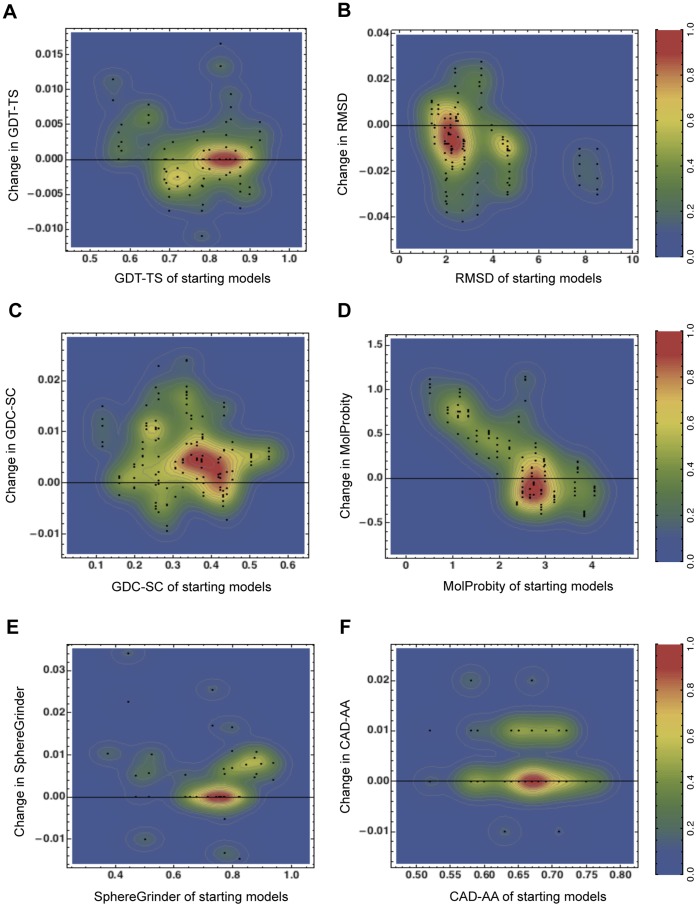
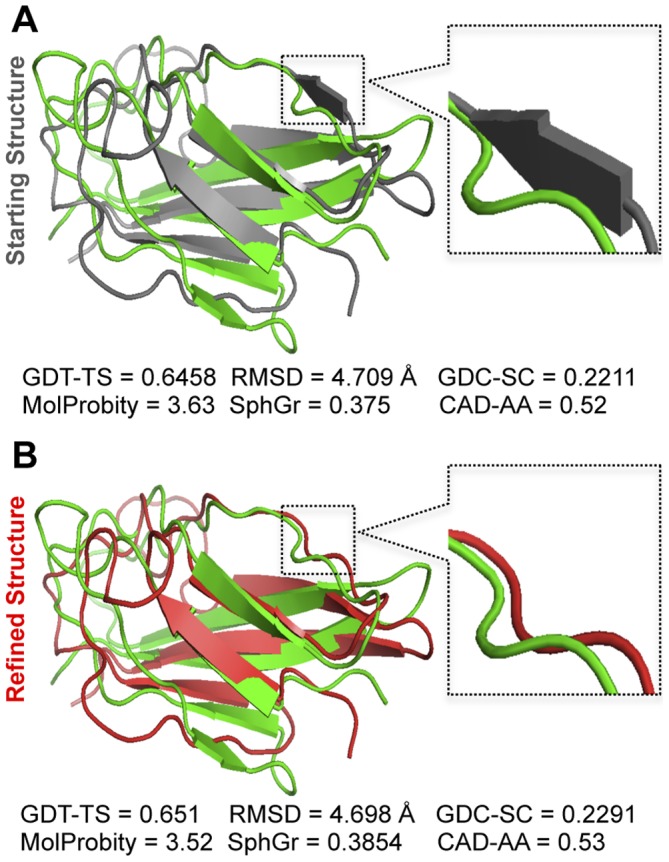
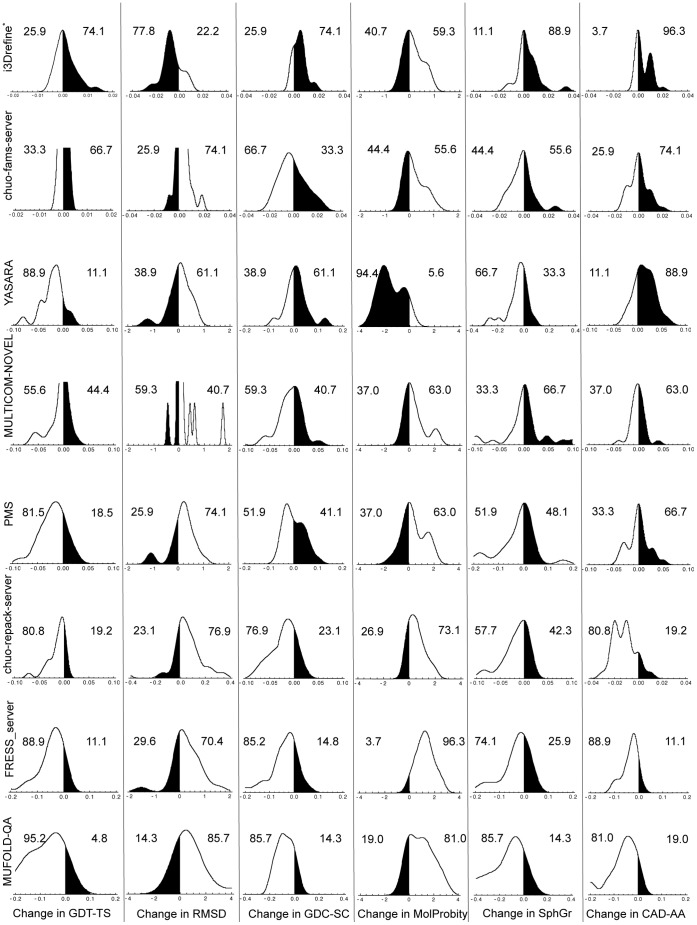
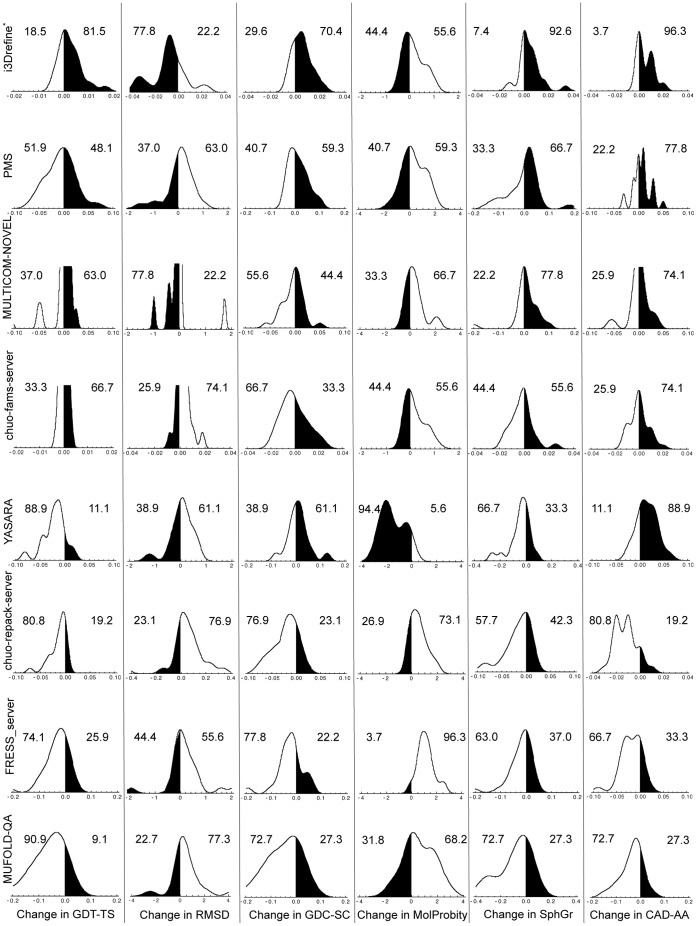
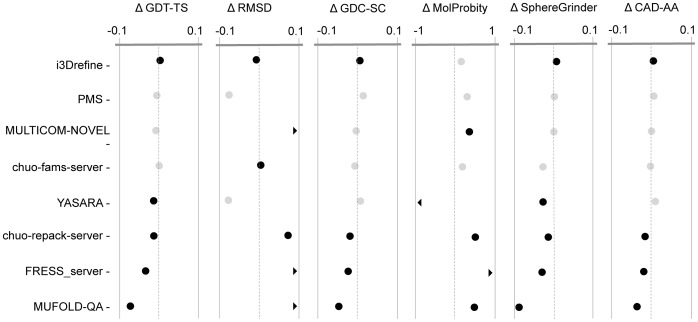
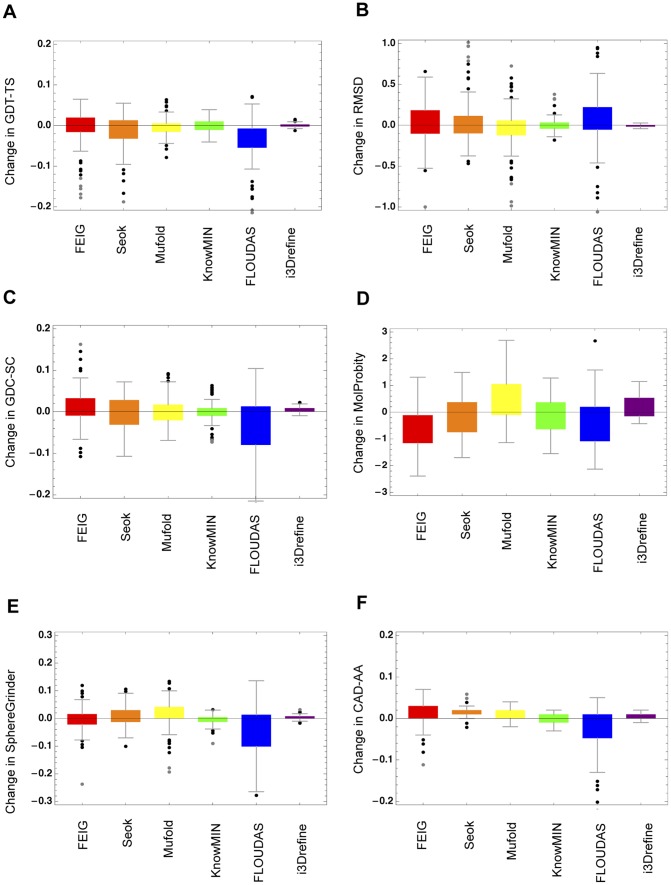
Protein structure refinement refers to the process of improving the qualities of protein structures during structure modeling processes to bring them closer to their native states. Structure refinement has been drawing increasing attention in the community-wide Critical Assessment of techniques for Protein Structure prediction (CASP) experiments since its addition in 8(th) CASP experiment. During the 9(th) and recently concluded 10(th) CASP experiments, a consistent growth in number of refinement targets and participating groups has been witnessed. Yet, protein structure refinement still remains a largely unsolved problem with majority of participating groups in CASP refinement category failed to consistently improve the quality of structures issued for refinement. In order to alleviate this need, we developed a completely automated and computationally efficient protein 3D structure refinement method, i3Drefine, based on an iterative and highly convergent energy minimization algorithm with a powerful all-atom composite physics and knowledge-based force fields and hydrogen bonding (HB) network optimization technique. In the recent community-wide blind experiment, CASP10, i3Drefine (as 'MULTICOM-CONSTRUCT') was ranked as the best method in the server section as per the official assessment of CASP10 experiment. Here we provide the community with free access to i3Drefine software and systematically analyse the performance of i3Drefine in strict blind mode on the refinement targets issued in CASP10 refinement category and compare with other state-of-the-art refinement methods participating in CASP10. Our analysis demonstrates that i3Drefine is only fully-automated server participating in CASP10 exhibiting consistent improvement over the initial structures in both global and local structural quality metrics. Executable version of i3Drefine is freely available at http://protein.rnet.missouri.edu/i3drefine/.


Conflict of interest statement

Competing Interests: The authors have declared that no competing interests exist.

Figures

Figure 1
Figure 1. Distribution of i3Drefine refinement for all submitted structures.
Distributions of change in quality scores after i3Drefine refinement are shown for these metrics: (A) GDT-TS, (B) RMSD, (C) GDC-SC, (D) MolProbity, (E) SphereGrinder and (F) CAD-AA. Regions shaded in black indicate improvement over the starting model. The numeric values are the percentage of times the structures were made better or worse for each metric.
Figure 2
Figure 2. Distributions of score changes with respect to the quality of starting structures.
Relationships between changes in quality scores and the quality of the starting models are shown for these metrics: (A) GDT-TS, (B) RMSD, (C) GDC-SC, (D) MolProbity, (E) SphereGrinder and (F) CAD-AA. The Black points indicate the actual data points while the contours are filled with colours that vary from blue for low density to red for high density. The colour function has been scaled between 0 and 1 and the legends are shown on the right.
Figure 3
Figure 3. Example of i3Drefine refinement for CASP10 target TR705.
(A) Structural superposition of initial model (grey) on native structure (green). (B) Structural superposition of refined model using i3Drefine (red) on native structure (green). The values of the quality measures before and after refinement have been reported under the models. The black dotted square highlights the region with prominent structural improvements and a closer look of the change is shown in the right.
Figure 4
Figure 4. Distribution and degree of refinement for top server groups based on first submitted model.
Distribution and degree of score changes relative to starting models for the 8 groups based on the first submitted models. The X-axis shows changes in scores with respect to the starting model. Regions shaded in black indicate improvement over the starting model. The numeric values are the percentage of times the structures were made better or worse than the starting model for each metric. The groups are ordered by the sum of overall quality score. * CASP10 group name for i3Drefine is MULTICOM-CONSTRUCT.
Figure 5
Figure 5. Distribution and degree of refinement for top server groups based on best submitted model.
Distribution and degree of score changes relative to starting models for the 8 groups based on the best submitted models as judged by quality score for each target. The X-axis shows changes in scores with respect to the starting model. Regions shaded in black indicate improvement over the starting model. The numeric values are the percentage of times the structures were made better or worse than the starting model for each metric. The groups are ordered by the sum of overall quality score. * CASP10 group name for i3Drefine is MULTICOM-CONSTRUCT.
Figure 6
Figure 6. Summary of the average score changes and their statistical significance for top server groups based on best submitted model.
Average score changes and their statistical significance relative to starting models for the 8 groups based on the best submitted models as judged by quality score for each target. Each column shows one of the metrics we used to evaluate performance. The scales are marked at ± Average Changes relative to the ‘Void’ group. For GDT-TS, GDC-SC, SphereGrinder and CAD-AA scores, positive changes indicate the quality of the model has been improved by refinement whereas for RMSD and MolProbity, negative changes represent improvement. Black points are statistically distinguishable from the ‘Void’ group; gray points are indistinguishable (Wilcoxon signed-rank test, P = 0.05). A chevron indicates that the corresponding score is off the scale.
Figure 7
Figure 7. Summary of the average score changes and their statistical significance for top server groups based on best submitted model.
Average score changes and their statistical significance relative to starting models for the 8 groups based on the best submitted models as judged by quality score for each target. Each column shows one of the metrics we used to evaluate performance. The scales are marked at ± Average Changes relative to the ‘Void’ group. For GDT-TS, GDC-SC, SphereGrinder and CAD-AA scores, positive changes indicate the quality of the model has been improved by refinement whereas for RMSD and MolProbity, negative changes represent improvement. Black points are statistically distinguishable from the Null group; gray points are indistinguishable (Wilcoxon signed-rank test, P = 0.05). A chevron indicates that the corresponding score is off the scale.
Figure 8
Figure 8. Quartile plots of score changes with respect to the quality of starting structures for top human predictors and i3Drefine.
Quartile plots of score changes relative to starting models for 5 human predictors and i3Drefine are shown for these metrics: (A) GDT-TS, (B) RMSD, (C) GDC-SC, (D) MolProbity, (E) SphereGrinder and (F) CAD-AA. The points outside the boxes indicate the outliers.

References

    1. Kopp J, Bordoli L, Battey JND, Kiefer F, Schwede T (2007) Assessment of CASP7 predictions for template-based modeling targets. Proteins: Structure, Function, and Bioinformatics 69: 38–56. - PubMed
    1. Keedy DA, Williams CJ, Headd JJ, Arendall WB, Chen VB, et al. (2009) The other 90% of the protein: Assessment beyond the Cαs for CASP8 template-based and high-accuracy models. Proteins: Structure, Function, and Bioinformatics 77: 29–49. - PMC - PubMed
    1. Mariani V, Kiefer F, Schmidt T, Haas J, Schwede T (2011) Assessment of template based protein structure predictions in CASP9. Proteins: Structure, Function, and Bioinformatics. - PubMed
    1. Cozzetto D, Kryshtafovych A, Fidelis K, Moult J, Rost B, et al. (2009) Evaluation of template-based models in CASP8 with standard measures. Proteins: Structure, Function, and Bioinformatics 77: 18–28. - PMC - PubMed
    1. Jauch R, Yeo HC, Kolatkar PR, Clarke ND (2007) Assessment of CASP7 structure predictions for template free targets. Proteins: Structure, Function, and Bioinformatics 69: 57–67. - PubMed

Publication types

LinkOut - more resources