. 2013 Jul 23;8(7):e69824.
doi: 10.1371/journal.pone.0069824. Print 2013.

High glucose promotes Aβ production by inhibiting APP degradation

Affiliations

High glucose promotes Aβ production by inhibiting APP degradation

Yi Yang et al. PLoS One. .

Abstract

Abnormal deposition of neuriticplaques is the uniqueneuropathological hallmark of Alzheimer's disease (AD).Amyloid β protein (Aβ), the major component of plaques, is generated from sequential cleavage of amyloidβ precursor protein (APP) by β-secretase and γ-secretase complex. Patients with diabetes mellitus (DM), characterized by chronic hyperglycemia,have increased risk of AD development.However, the role of high blood glucose in APP processing and Aβ generation remains elusive. In this study, we investigated the effect of high glucose on APP metabolism and Aβ generation in cultured human cells. We found that high glucose treatment significantly increased APP protein level in both neuronal-like and non-neuronal cells, and promoted Aβ generation. Furthermore, we found that high glucose-induced increase of APP level was not due to enhancement of APP gene transcription but resulted from inhibition of APP protein degradation. Taken together, our data indicated that hyperglycemia could promote AD pathogenesis by inhibiting APP degradation and enhancing Aβ production. More importantly, the elevation of APP level and Aβ generation by high glucose was caused by reduction of APP turnover rate.Thus,our study provides a molecular mechanism of increased risk of developing AD in patients withDMand suggests thatglycemic control might be potentially beneficial for reducing the incidence of AD in diabetic patients and delaying the AD progression.


Conflict of interest statement

Competing Interests: The authors have declared that no competing interests exist.

Figures

Figure 1
Figure 1. High glucose treatment increases full-length APP protein level.
SH-SY5Y cells were treated with different concentration of glucose for 24 hours (A), and 48 hours(C) with2.5 mM glucose treatment serving as control. The cell lysates were analyzed by Western blot. Full-length APP was detected by C20 antibody. β-actin, serving as internal control, was detected by AC-15 antibody. 24-hour and 48-hour of high glucose treatment significantly increased full-length APP protein level.Quantification of full-length APP after 24-hour treatment of high glucose in SH-SY5Y cells (B). The values are expressed as mean±S.E.M, n = 4,*p<0.05 by ANOVA. Quantification of full-length APP after 48-hour treatment of high glucose in SH-SY5Y cells (D) The values are expressed as mean±S.E.M, n = 3,*p<0.05 by ANOVA.
Figure 2
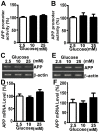
Figure 2. High glucose treatment does not affect APP transcription.
The 2.94 kb human APP promoter was transfected into SH-SY5Ycells and treated with high glucose for 24 hours (A) and 48 hours (B). 2.5 mM glucose serves as control. Luciferase assasy was performed.High glucose treatment did not affect APP promoter activity. All the promoter data shown are results of 4 independent experiments, with each condition performed in triplicates. The values are expressed as mean±S.E.M. n = 4, by ANOVA. SH-SY5Y cells were treated with different concentration of glucose for 24 hours(C) and 48 hours (E). RNA was extracted and APP mRNA level was measured by semi-quantitative PCR with specific primers. β-actin served as an internal control. 24-hourand 48-hourtreatment of high glucose did not significantly affect APP mRNA. Quantification of full-length APP after 24-hour treatment of high glucose (D)The values are expressed as mean±S.E.M, n = 7, by ANOVA. Quantification of full-length APP after 48-hour treatment of high glucose (F)The values are expressed as mean±S.E.M, n = 5, by ANOVA.
Figure 3
Figure 3. High glucose treatment inhibits APP protein degradation.
20E2 cells were treated with 5.5 mM, 10 mM or 25 mM glucose for 24 hours, and the cell lysates were analyzed by Western blot (A). Full-length APP was detected by C20 antibody. β-actin, serving as internal control, was detected by AC-15 antibody. The level of APP protein was quantified by Image J (B). The values are expressed as mean±S.E.M. n = 3,*p<0.0001, by ANOVA. For APP degradation experiment, 20E2 cells were treated with culturing media containing 100 ug/ml CHX along with 5.5 mM or 10 mM glucose. The cell lysates were harvested at 0, 15, 30 or 60 minutes after treatment and analyzed by Western blot (C, D).Quantification of APP protein by Image J (E). APP protein level was plotted as a percentage of the amount at 0 minute. The values are expressed as mean±S.E.M. n = 3,*p<0.001, by two-way ANOVA. The APP degradation experiment was also conducted using SH-SY5Y cells treated with 100 ug/ml CHX along with 5.5 mM, 10 mM or 25 mM glucose for 30 minutes. The cell lysates were analyzed by Western blot (F).The level of APP protein was quantified by Image J(G) andwas plotted as a percentage of the amount at 0 minute. The values are expressed as mean±S.E.M. n = 3,*p<0.05, by ANOVA.
Figure 4
Figure 4. High glucose treatment increases C99 and Aβ40 production.
The 20E2 cells were cultured and treated with different concentrations of glucose for 24 hours. Media containing 5.5 mM glucose served as control. The cell lysates were analyzed by western blot (A).C99 was detected by C20 antibody. β-actin, serving as internal control, was detected by AC-15 antibody. Quantification of C99 after 24-hour treatment of high glucose in 20E2 cells (B) The values are expressed as mean±S.E.M, n = 3,*p<0.001 by ANOVA The level of Aβ40 in conditioned media of 20E2 cells was measured by ELISA(C). The values are expressed as mean±S.E.M, n = 4, *p<0.001, by ANOVA.

References

    1. Wimo A, Prince M (2010) World Alzheimer Report 2010: The Global Economic Impact of Dementia. Alzheimer’s Disease International, London 1–56.
    1. Querfurth HW, LaFerla FM (2010) Alzheimer’s Disease. New England Journal of Medicine 362: 329–344. - PubMed
    1. Reitz C, Brayne C, Mayeux R (2011) Epidemiology of Alzheimer disease. Nat Rev Neurol 7: 137–152. - PMC - PubMed
    1. Goldgaber D, Lerman MI, McBride OW, Saffiotti U, Gajdusek DC (1987) Characterization and chromosomal localization of a cDNA encoding brain amyloid of Alzheimer’s disease. Science 235: 877–880. - PubMed
    1. Kang J, Lemaire HG, Unterbeck A, Salbaum JM, Masters CL, et al. (1987) The precursor of Alzheimer’s disease amyloid A4 protein resembles a cell-surface receptor. Nature 325: 733–736. - PubMed

Publication types

MeSH terms

Substances

LinkOut - more resources