

Analysis of cannabis seizures in NSW, Australia: cannabis potency and cannabinoid profile
- PMID: 23894589
- PMCID: PMC3722200
- DOI: 10.1371/journal.pone.0070052
Analysis of cannabis seizures in NSW, Australia: cannabis potency and cannabinoid profile
Abstract
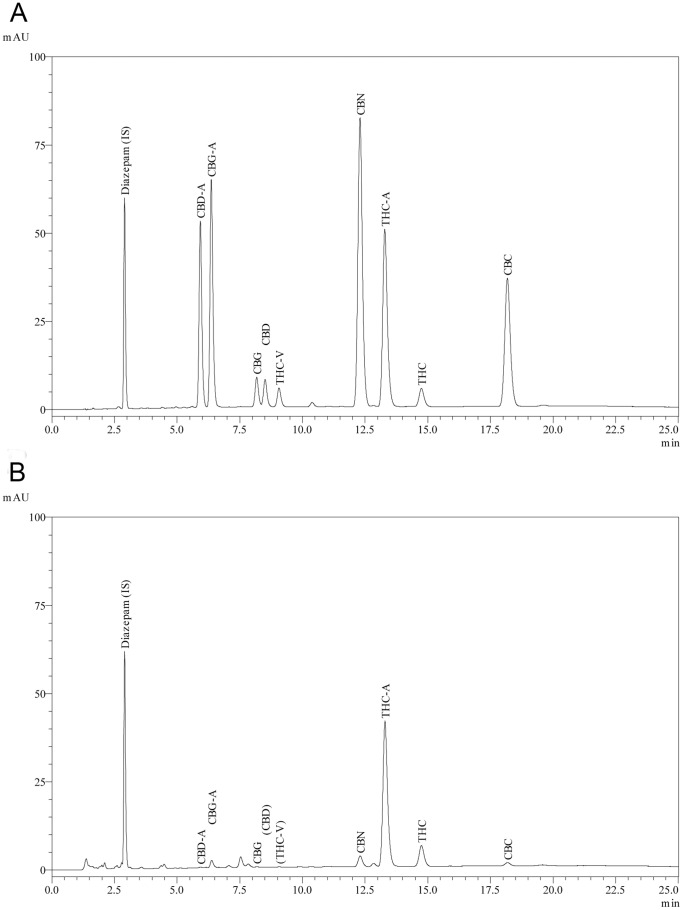
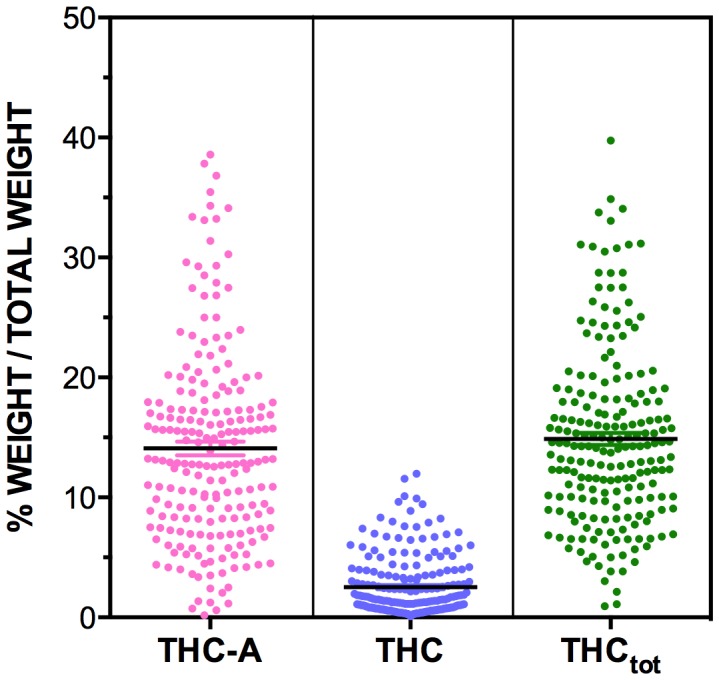
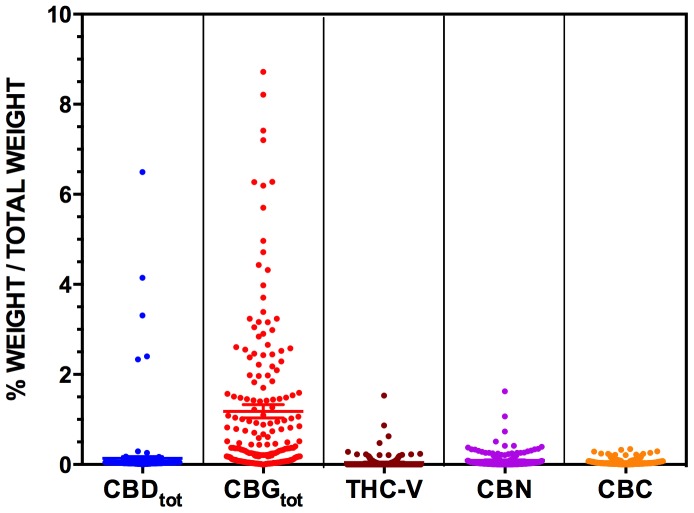
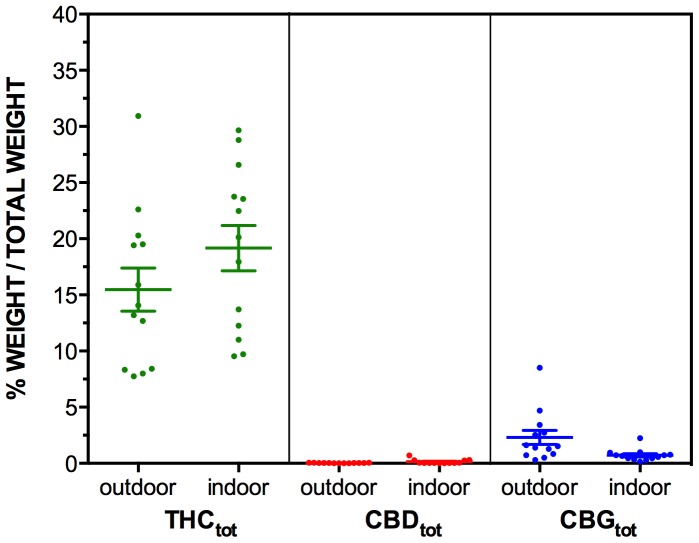
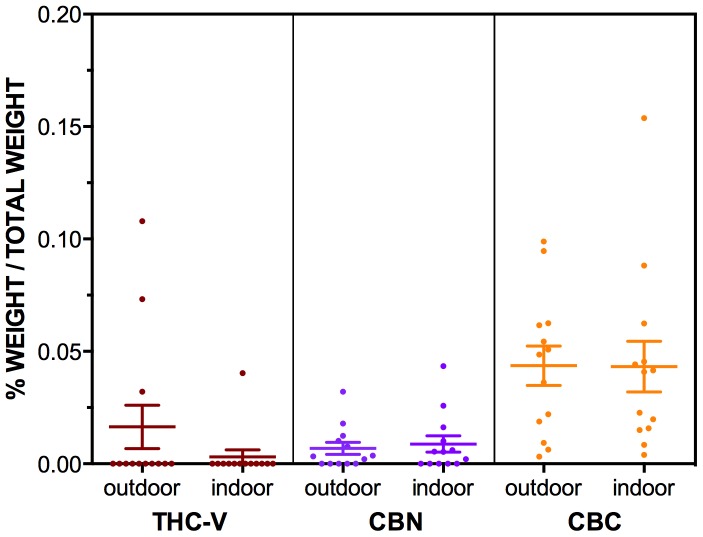
Recent analysis of the cannabinoid content of cannabis plants suggests a shift towards use of high potency plant material with high levels of Δ(9)-tetrahydrocannabinol (THC) and low levels of other phytocannabinoids, particularly cannabidiol (CBD). Use of this type of cannabis is thought by some to predispose to greater adverse outcomes on mental health and fewer therapeutic benefits. Australia has one of the highest per capita rates of cannabis use in the world yet there has been no previous systematic analysis of the cannabis being used. In the present study we examined the cannabinoid content of 206 cannabis samples that had been confiscated by police from recreational users holding 15 g of cannabis or less, under the New South Wales "Cannabis Cautioning" scheme. A further 26 "Known Provenance" samples were analysed that had been seized by police from larger indoor or outdoor cultivation sites rather than from street level users. An HPLC method was used to determine the content of 9 cannabinoids: THC, CBD, cannabigerol (CBG), and their plant-based carboxylic acid precursors THC-A, CBD-A and CBG-A, as well as cannabichromene (CBC), cannabinol (CBN) and tetrahydrocannabivarin (THC-V). The "Cannabis Cautioning" samples showed high mean THC content (THC+THC-A = 14.88%) and low mean CBD content (CBD+CBD-A = 0.14%). A modest level of CBG was detected (CBG+CBG-A = 1.18%) and very low levels of CBC, CBN and THC-V (<0.1%). "Known Provenance" samples showed no significant differences in THC content between those seized from indoor versus outdoor cultivation sites. The present analysis echoes trends reported in other countries towards the use of high potency cannabis with very low CBD content. The implications for public health outcomes and harm reduction strategies are discussed.
Conflict of interest statement
Figures
References
-
- Arnold JC, Boucher AA, Karl T (2012) The yin and yang of cannabis-induced psychosis: the actions of Delta(9)-tetrahydrocannabinol and cannabidiol in rodent models of schizophrenia. Curr Pharm Des 18: 5113–5130. - PubMed
-
- Cascini F, Aiello C, Di Tanna G (2012) Increasing delta-9-tetrahydrocannabinol (Delta-9-THC) content in herbal cannabis over time: systematic review and meta-analysis. Curr Drug Abuse Rev 5: 32–40. - PubMed
-
- Hardwick S, King L (2008) Home Office Cannabis Potency Study 2008. St Albans: Home Office.
-
- Knight G, Hansen S, Connor M, Poulsen H, McGovern C, et al. (2010) The results of an experimental indoor hydroponic Cannabis growing study, using the ‘Screen of Green’ (ScrOG) method-Yield, tetrahydrocannabinol (THC) and DNA analysis. Forensic Sci Int 202: 36–44. - PubMed
-
- Mehmedic Z, Chandra S, Slade D, Denham H, Foster S, et al. (2010) Potency trends of Delta9-THC and other cannabinoids in confiscated cannabis preparations from 1993 to 2008. J Forensic Sci 55: 1209–1217. - PubMed
Publication types
MeSH terms
Substances
LinkOut - more resources
Full Text Sources
Other Literature Sources
Research Materials
Miscellaneous
