

Crop pollination exposes honey bees to pesticides which alters their susceptibility to the gut pathogen Nosema ceranae
- PMID: 23894612
- PMCID: PMC3722151
- DOI: 10.1371/journal.pone.0070182
Crop pollination exposes honey bees to pesticides which alters their susceptibility to the gut pathogen Nosema ceranae
Abstract
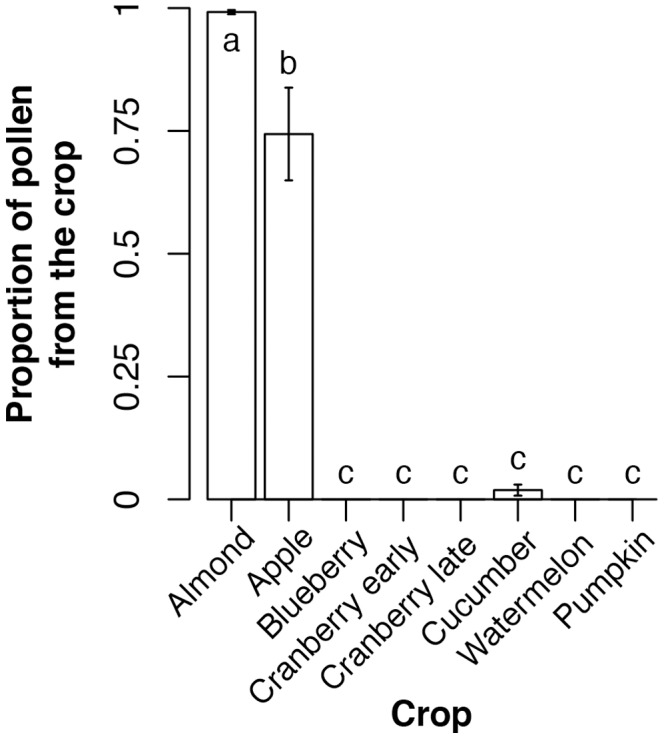
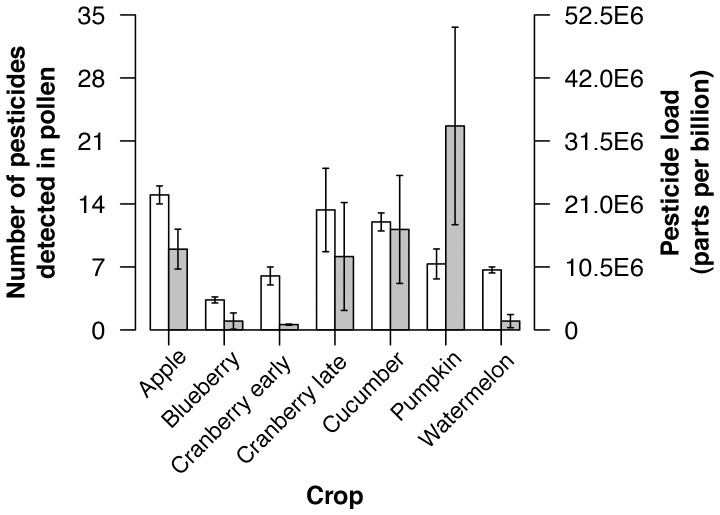
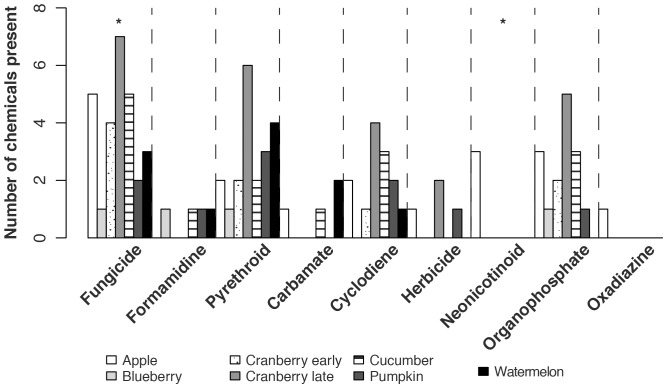
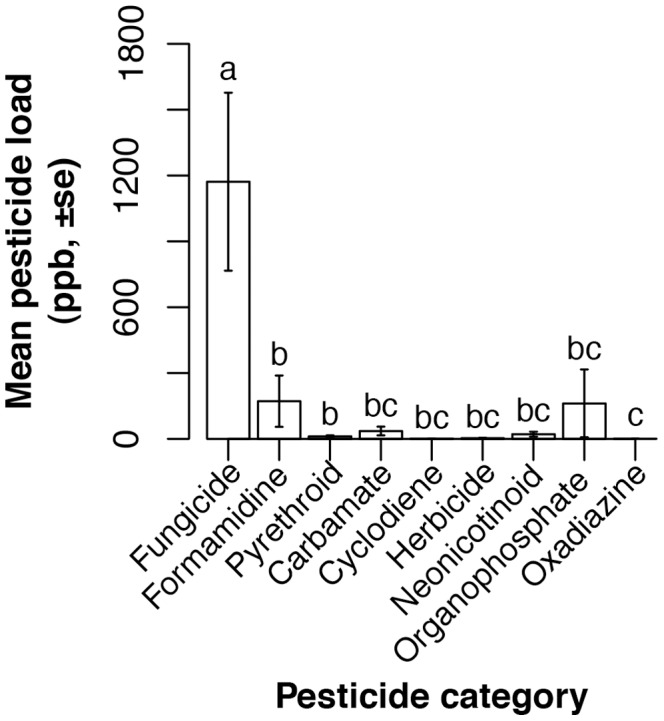
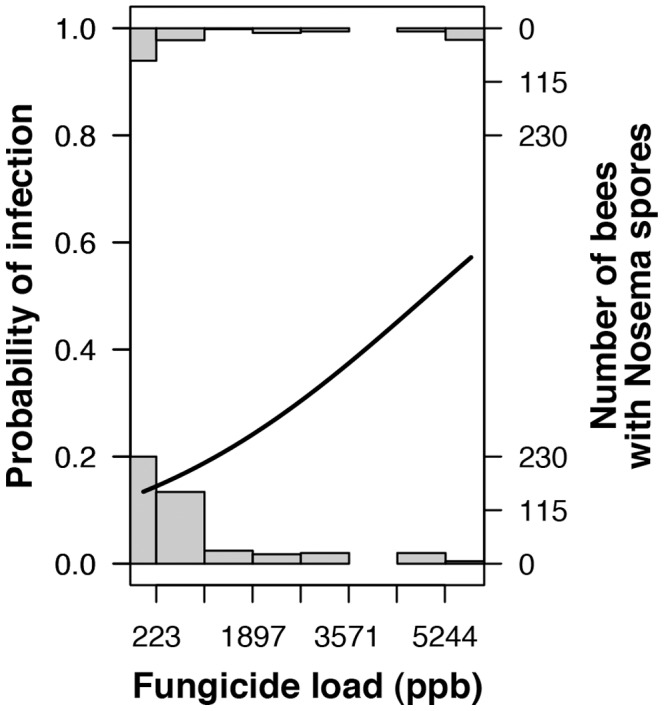
Recent declines in honey bee populations and increasing demand for insect-pollinated crops raise concerns about pollinator shortages. Pesticide exposure and pathogens may interact to have strong negative effects on managed honey bee colonies. Such findings are of great concern given the large numbers and high levels of pesticides found in honey bee colonies. Thus it is crucial to determine how field-relevant combinations and loads of pesticides affect bee health. We collected pollen from bee hives in seven major crops to determine 1) what types of pesticides bees are exposed to when rented for pollination of various crops and 2) how field-relevant pesticide blends affect bees' susceptibility to the gut parasite Nosema ceranae. Our samples represent pollen collected by foragers for use by the colony, and do not necessarily indicate foragers' roles as pollinators. In blueberry, cranberry, cucumber, pumpkin and watermelon bees collected pollen almost exclusively from weeds and wildflowers during our sampling. Thus more attention must be paid to how honey bees are exposed to pesticides outside of the field in which they are placed. We detected 35 different pesticides in the sampled pollen, and found high fungicide loads. The insecticides esfenvalerate and phosmet were at a concentration higher than their median lethal dose in at least one pollen sample. While fungicides are typically seen as fairly safe for honey bees, we found an increased probability of Nosema infection in bees that consumed pollen with a higher fungicide load. Our results highlight a need for research on sub-lethal effects of fungicides and other chemicals that bees placed in an agricultural setting are exposed to.
Conflict of interest statement
Figures
Similar articles
-
Pesticide risk to managed bees during blueberry pollination is primarily driven by off-farm exposures.Sci Rep. 2022 May 3;12(1):7189. doi: 10.1038/s41598-022-11156-1. Sci Rep. 2022. PMID: 35504929 Free PMC article.
-
Physiological effects of the interaction between Nosema ceranae and sequential and overlapping exposure to glyphosate and difenoconazole in the honey bee Apis mellifera.Ecotoxicol Environ Saf. 2021 Jul 1;217:112258. doi: 10.1016/j.ecoenv.2021.112258. Epub 2021 Apr 26. Ecotoxicol Environ Saf. 2021. PMID: 33915451
-
Field cross-fostering and in vitro rearing demonstrate negative effects of both larval and adult exposure to a widely used fungicide in honey bees (Apis mellifera).Ecotoxicol Environ Saf. 2021 Jul 1;217:112251. doi: 10.1016/j.ecoenv.2021.112251. Epub 2021 Apr 24. Ecotoxicol Environ Saf. 2021. PMID: 33905983
-
Interactive effects of pesticide exposure and pathogen infection on bee health - a critical analysis.Biol Rev Camb Philos Soc. 2016 Nov;91(4):1006-1019. doi: 10.1111/brv.12206. Epub 2015 Jul 6. Biol Rev Camb Philos Soc. 2016. PMID: 26150129 Review.
-
Nosema ceranae in European honey bees (Apis mellifera).J Invertebr Pathol. 2010 Jan;103 Suppl 1:S73-9. doi: 10.1016/j.jip.2009.06.017. Epub 2009 Nov 11. J Invertebr Pathol. 2010. PMID: 19909977 Review.
Cited by
-
Fungicides and insecticides can alter the microbial community on the cuticle of honey bees.Front Microbiol. 2023 Oct 30;14:1271498. doi: 10.3389/fmicb.2023.1271498. eCollection 2023. Front Microbiol. 2023. PMID: 37965543 Free PMC article.
-
RNA Interference-Mediated Knockdown of Genes Encoding Spore Wall Proteins Confers Protection against Nosema ceranae Infection in the European Honey Bee, Apis mellifera.Microorganisms. 2021 Feb 27;9(3):505. doi: 10.3390/microorganisms9030505. Microorganisms. 2021. PMID: 33673613 Free PMC article.
-
Comprehensive Survey of Area-Wide Agricultural Pesticide Use in Southern United States Row Crops and Potential Impact on Honey Bee Colonies.Insects. 2019 Sep 2;10(9):280. doi: 10.3390/insects10090280. Insects. 2019. PMID: 31480713 Free PMC article.
-
Endocrine and immune responses of larval amphibians to trematode exposure.Parasitol Res. 2019 Jan;118(1):275-288. doi: 10.1007/s00436-018-6154-6. Epub 2018 Nov 19. Parasitol Res. 2019. PMID: 30456491
-
Sublethal effects of clothianidin and Nosema spp. on the longevity and foraging activity of free flying honey bees.Ecotoxicology. 2018 Jul;27(5):527-538. doi: 10.1007/s10646-018-1925-5. Epub 2018 Mar 19. Ecotoxicology. 2018. PMID: 29556938
References
-
- vanEngelsdorp D, Meixner MD (2010) A historical review of managed honey bee populations in Europe and the United States and the factors that may affect them. Journal of Invertebrate Pathology 103: S80–S95. - PubMed
-
- vanEngelsdorp D, Caron D, Hayes J, Underwood R, Henson M, et al. (2012) A national survey of managed honey bee 2010–11 winter colony losses in the USA: results from the Bee Informed Partnership. Journal of Apicultural Research 51: 115–124.
-
- van der Zee R, Pisa L, Andonov S, Brodschneider R, Charriere JD, et al. (2012) Managed honey bee colony losses in Canada, China, Europe, Israel and Turkey, for the winters of 2008–9 and 2009–10. Journal of Apicultural Research 51: 91–114.
Publication types
MeSH terms
Substances
LinkOut - more resources
Full Text Sources
Other Literature Sources
Medical
