. 2013 Jul 24;8(7):e70283.
doi: 10.1371/journal.pone.0070283. Print 2013.

Glycolipid transfer protein expression is affected by glycosphingolipid synthesis

Affiliations

Glycolipid transfer protein expression is affected by glycosphingolipid synthesis

Matti A Kjellberg et al. PLoS One. .

Erratum in

Abstract

Members of the glycolipid transfer protein superfamily (GLTP) are found from animals and fungi to plants and red micro-alga. Eukaryotes that encode the glucosylceramide synthase responsible for the synthesis of glucosylceramide, the precursor for most glycosphingolipids, also produce GLTPs. Cells that does not synthesize glucosylceramide neither express GLTPs. Based on this genetic relationship there must be a strong correlation between the synthesis of glucosylceramide and GLTPs. To regulate the levels of glycolipids we have used inhibitors of intracellular trafficking, glycosphingolipid synthesis and degradation, and small interfering RNA to down-regulate the activity of glucosylceramide synthase activity. We found that GLTP expression, both at the mRNA and protein levels, is elevated in cells that accumulate glucosylceramide. Monensin and brefeldin A block intracellular vesicular transport mechanisms. Brefeldin A treatment leads to accumulation of newly synthesized glucosylceramide, galactosylceramide and lactosylceramide in a fused endoplasmic reticulum-Golgi complex. On the other hand, inhibiting glycosphingolipid degradation with conduritol-B-epoxide, that generates glucosylceramide accumulation in the lysosomes, did not affect the levels of GLTP. However, glycosphingolipid synthesis inhibitors like PDMP, NB-DNJ and myriocin, all decreased glucosylceramide and GLTP below normal levels. We also found that an 80% loss of glucosylceramide due to glucosylceramide synthase knockdown resulted in a significant reduction in the expression of GLTP. We show here that interfering with membrane trafficking events and simple neutral glycosphingolipid synthesis will affect the expression of GLTP. We postulate that a change in the glucosylceramide balance causes a response in the GLTP expression, and put forward that GLTP might play a role in lipid directing and sensing of glucosylceramide at the ER-Golgi interface.


Conflict of interest statement

Competing Interests: The authors have declared that no competing interests exist.

Figures

Figure 1
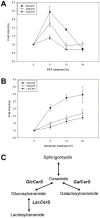
Figure 1. GLTP expression, GlcCer, Galcer, LacCer, ceramide and sphingomyelin synthesis in HSF cells as a function of BFA or monensin treatment.
A) HFS cells were treated with BFA (left panel) or monensin (right panel) with increasing concentrations for 24 hours. The GLTP mRNA expression levels were analyzed using qPCR and corrected to an 18S rRNA internal control. B) qPCR analysis of GLTP expression (filled circles) and sphingolipid levels in HSF cells treated with BFA (0.01 µg/ml, left panel) or monensin (5 µg/ml, right panel) for 6, 12 and 24 hours, 3H-sphinganine incorporation into the sphingolipids was analyzed using TLC. qPCR results are expressed as means +/− SD of at least three independent experiments. The data for the incorporation of the radiolabeled 3H-sphinganine are from at least three different experiments, and the results are normalized to the controls. Two asterisks (**), p<0.01 and three asterisks (***), p<0.005 indicate the statistical significance compared to the controls. C) Western blot analysis of GLTP levels in HSF cells treated with BFA (0.01 µg/ml) or monensin (5 µg/ml) for 24 hours. C = untreated control, B = BFA treatment, M = monensin treatment. β-Actin was used as a loading control. The representative blot shown here was chosen from one of three independent experiments with similar results.
Figure 2
Figure 2. Changes in the mass of GlcCer, GalCer and LacCer.
HSF cells were treated with BFA or monensin for 24 h and visualized with orcinol-sulphuric acid on a high performance TLC silica plate. OH-GalCer, hydroxylated GalCer. The representative TLC plate shown here was chosen from one of three independent experiments with similar results.
Figure 3
Figure 3. Effects of BFA and monensin on GlcCerS, GalCerS and LacCerS mRNA expression levels.
qPCR analysis of the expression levels in cells treated with A) BFA (0.01 µg/ml) and B) monensin (5 µg/ml) for 0, 6, 12 and 24 hours. The qPCR results are expressed as means +/− SD of three independent experiments. C) Scheme of the enzymes in the sphingolipid metabolism analyzed in this study, GalCerS (galactosylceramide synthase) GlcCerS (glucosylceramide synthase) and LacCerS (lactosylceramide synthase).
Figure 4
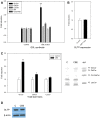
Figure 4. Effect of CBE treatment on GLTP mRNA and protein levels.
HSF cells were treated with CBE (250 µM) for 5 days. A) Simple sphingolipid levels were determined by 3H-sphinganine incorporation and TLC analysis. Incorporation of 3H-sphinganine into GlcCer, GalCer, LacCer, SM and ceramide in untreated controls compared to CBE treated cells. GlcCer (***) levels in CBE treated cells are significantly higher than their controls (p<0.005). B) The GLTP mRNA expression was determined by qPCR in CBE treated HSF cells. Results are expressed as means +/− SD of three independent qPCR experiments. C) The total lipid mass of GlcCer, GalCer and LacCer as visualized by orcinol-sulphuric acid on a HPTLC plate, as well as lipid band intensities semi-quantified using ImageJ software and normalized to the controls. GlcCer (**) levels in CBE treated cells are significantly higher than their controls (p<0.01). D) Western blot of cells treated as described above, C = untreated controls, CBE = 5 day CBE treatment (250 µM). β-Actin was used as a loading control.
Figure 5
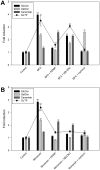
Figure 5. GlcCer, GalCer and Cer and GLTP mRNA levels in HSF cells co-treated with BFA/monensin and different GlcCer synthesis inhibitors.
A) 3H-sphinganine incorporation and GLTP mRNA levels (filled circles) in HSF cells treated with either BFA (0.01 µg/ml) as well as HSF cells co-treated with BFA in addition to PDMP (50 µM), NB-DNJ (250 µM) and myriocin (25 µM). B) 3H-sphinganine incorporation and GLTP mRNA levels (filled circles) in HSF cells treated with either monensin (5 µg/ml) as well as HSF cells co-treated with monensin in addition to PDMP (50 µM), NB-DNJ (250 µM) and myriocin (25 µM). HSF cells treated with myriocin were labeled with 3H-palmitic acid. The results are expressed as means +/− SD of three independent experiments. Two asterisks (**), p<0.01 and three asterisks (***), p<0.005 indicate the statistical significance compared to the controls.
Figure 6
Figure 6. Effect of GSL synthesis inhibitors on GlcCer, Galcer, LacCer and GLTP protein and mRNA levels.
A) 3H-palmitic acid incorporation into GlcCer, GalCer and LacCer and GLTP expression levels (filled circles) in HSF cells treated with PDMP (50 µM), NB-DNJ (250 µM) or myriocin (25 µM) for 24 hours. qPCR and precursor incorporation results are expressed as means +/− SD of at least three independent experiments. The asterisk (*), p<0.01 indicate the statistical significance compared to the controls. B) GLTP levels analyzed by Western blot in HSF cells treated with myriocin (25 µM) for 72 hours. β-actin was used as a loading control. C = control and My = myriocin. C) The total lipid mass of GlcCer, GalCer and LacCer as visualized by orcinol-sulphuric acid spray on a high performance TLC plate, in HSF cells treated with myriocin (25 µM) for 72 hours. The lipid band intensities on the plate were also semi-quantified using ImageJ software and normalized to the intensities of the control spots. OH-GalCer, hydroxylated GalCer.
Figure 7
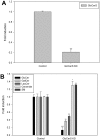
Figure 7. Knockdown of GlcCerS and effects on GSLs in HSF cells.
A) qPCR assessment of the GlcCerS levels induced by silencing the GlcCerS gene normalized to the levels in mock-transfected HSF cells. B) GlcCer, GalCer, LacCer, Cer and SM levels were measured in HSF cells labeled with 3H-sphinganine for XX hours, and normalized to the levels in normal control HSF cells. The significance in the changes of the lipid levels is indicated with asterisks. One asterisk (*), p<0.05, two asterisks (**), p<0.01 and three asterisks (***), p<0.005 indicate the statistical significance compared to the controls.
Figure 8
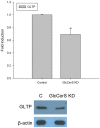
Figure 8. Expression of GLTP in GlcCerS knockdown HSF cells.
The GLTP levels were analyzed with both qPCR and Western blot in HSF cells with 80% down-regulated expression of the GlcCerS gene. The GLTP gene level was normalized to the level in mock-transfected HSF cells, and β-actin was used as a loading control in the GLTP protein expression analysis.
Figure 9
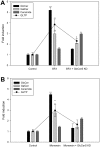
Figure 9. Expression of GLTP in GlcCerS knockdown cells with impaired intracellular membrane trafficking caused by BFA and monensin.
A) 3H-sphinganine incorporation into GlcCer, GalCer and Cer as well as GLTP mRNA levels (filled circles) in GlcCerS KD HSF cells treated with BFA (0.01 µg/ml) and B) treated with monensin (5 µg/ml). Two asterisks (**), p<0.01 and three asterisks (***), p<0.005 indicate the statistical significance compared to the controls.
Figure 10
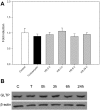
Figure 10. GLTP response to tunicamycin and heat shock.
A) GLTP mRNA expression determined by qPCR in cells undergoing heat shock and ER-stress. HSF cells were either heat shocked at 42°C for one hour, following different recovery periods (0–24 hours) at 37°C, or treated with tunicamycin (10 µg/ml) for 24 hours. Results are expressed as means +/− SD of three independent experiments. B) GLTP protein levels in HSF cells analyzed with Western blot after one hour heat shock followed by recovery, or tunicamycin at 10 µg/ml for 24 hours. C = control and T = tunicamycin, β-actin was used as a loading control.

Similar articles

Cited by

References

    1. Degroote S, Wolthoorn J, van Meer G (2004) The cell biology of glycosphingolipids. Semin Cell Dev Biol 15: 375–387. - PubMed
    1. Futerman AH, Pagano RE (1991) Determination of the intracellular sites and topology of glucosylceramide synthesis in rat liver. Biochem J 280: 295–302. - PMC - PubMed
    1. Jeckel D, Karrenbauer A, Burger KNJ, van Meer G, Wieland FT (1992) Glucosylceramide is synthesized at the cytosolic surface of various golgi subfractions. J Cell Biol 117: 259–267. - PMC - PubMed
    1. Burger KNJ, van der Bijl P, van Meer G (1996) Topology of sphingolipid galactosyltransferases in ER and Golgi: Transbilayer movement of monohexosyl sphingolipids is required for higher glycosphingolipid biosynthesis. J Cell Biol 133: 15–28. - PMC - PubMed
    1. Huitema K, Van Den Dikkenberg J, Brouwers JF, Holthuis JCM (2004) Identification of a family of animal sphingomyelin synthases. EMBO J 23: 33–44. - PMC - PubMed

Publication types

LinkOut - more resources