. 2013 Jul 22;8(7):e70410.
doi: 10.1371/journal.pone.0070410. Print 2013.

Lithium induces ER stress and N-glycan modification in galactose-grown Jurkat cells

Affiliations

Lithium induces ER stress and N-glycan modification in galactose-grown Jurkat cells

Tamás Nagy et al. PLoS One. .

Abstract

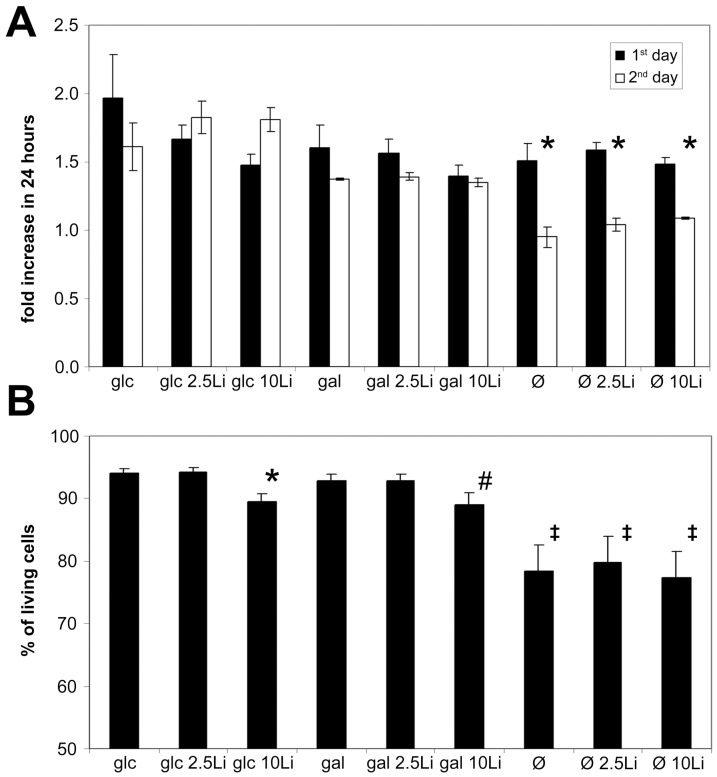
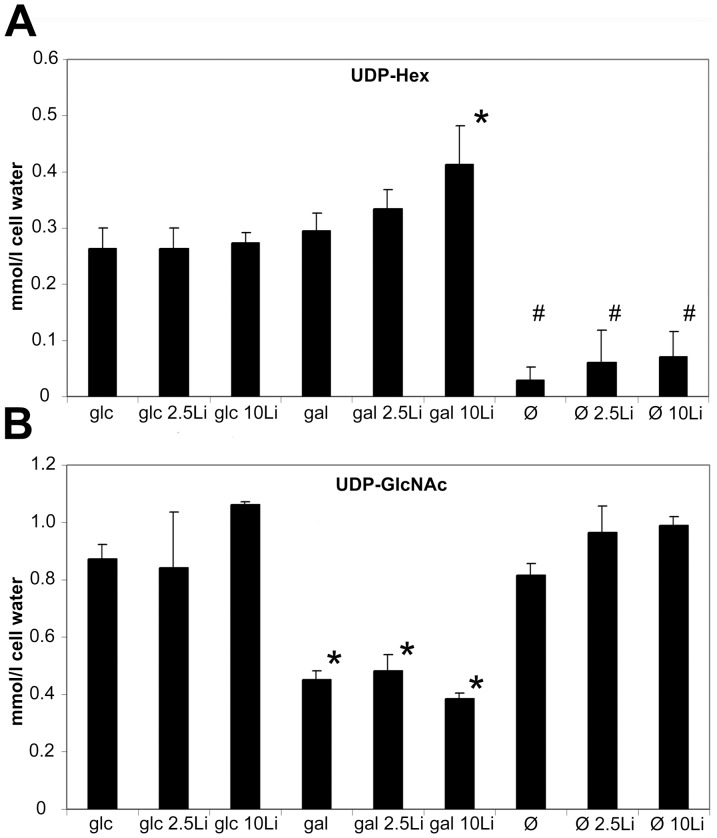
We previously reported that lithium had a significant impact on Ca(2+) regulation and induced unfolded protein response (UPR) in yeast cells grown on galactose due to inhibition of phosphoglucomutase (PGM), however the exact mechanism has not been established yet. In this study, we analysed lithium's effect in galactose-fed cells to clarify whether these ER-related changes are the result of a relative hypoglycemic state. Furthermore, we investigated whether the alterations in galactose metabolism impact protein post-translational modifications. Thus, Jurkat cells were incubated in glucose or galactose containing media with or without lithium treatment. We found that galactose-fed and lithium treated cells showed better survivability than fasting cells. We also found higher UDP-Hexose and glycogen levels in these cells compared to fasting cells. On the other hand, the UPR (X-box binding protein 1 mRNA levels) of galactose-fed and lithium treated cells was even greater than in fasting cells. We also found increased amount of proteins that contained N-linked N-acetyl-glucosamine, similar to what was reported in fasting cells by a recent study. Our results demonstrate that lithium treatment of galactose-fed cells can induce stress responses similar to hypoglycemia, however cell survival is still secured by alternative pathways. We propose that clarifying this process might be an important addition toward the better understanding of the molecular mechanisms that regulate ER-associated stress response.


Conflict of interest statement

Competing Interests: The authors have declared that no competing interests exist.

Figures

Figure 1
Figure 1. Growth potential of lithium treated Jurkat cells grown on galactose differ from fasting cells.
Jurkat cells were incubated in 5 mM glucose or 5 mM galactose containing or hexose-free media for 48 hours. Lithium concentrations were adjusted for each condition at 0, 2.5 or 10 mM. (A) Cell counting was performed using an Abbott Cell-Dyn 3700 Hematology Analyzer at 0, 24 and 48 hours of the incubation. Cell growth is expressed as a fold increase during 24 hour periods, measured at day 1 and 2. Data are means ±SD from at least 4 independent experiments. *P<0.05 vs. 24 hours earlier. (B) Jurkat cells were incubated as described above, after 48 hours the ratio of living cells (Annexin V and propidium-iodide negative) were measured using flow cytometry. Data are means ±SD from at least 4 independent experiments. *P = 0.056 vs. control (glc), #P<0.05 vs control (glc), P<0.01 vs control (glc).
Figure 2
Figure 2. Lithium elevates UDP-Hexose content in galactose-grown Jurkat cells.
(A) UDP-Hexose (UDP-Hex) [sum of UDP-Glucose (UDP-Glc) and UDP-Galactose (UDP-Gal)] levels from 5 mM glucose, 5 mM galactose treated or fasting cells, with 0, 2.5 or 10 mM Li treatment. After 48 hours incubation, UDP-Hex levels were measured using HPLC and expressed as mmol/cell water. Data are means ±SD from at least 4 independent experiments. *P<0.05 vs. control (glc), #P<0.01 vs control (glc). (B) UDP-N-acetylglucosamine (UDP-GlcNAc) levels from samples pretreated as described above. UDP-GlcNAc levels were measured using HPLC and expressed as mmol/cell water. Data are means ±SD from at least 4 independent experiments. *P<0.01 vs. control (glc).
Figure 3
Figure 3. Lithium increases the glycogen content of glucose or galactose-grown and fasting cells.
Jurkat cells were incubated in 5 mM glucose or 5 mM galactose containing or hexose-free media for 48 hours. Lithium concentration was adjusted for each condition at 0, 2.5 or 10 mM. After incubation, cytospin preps were stained with PAS to visualize glycogen content. Above: Representative images for each condition. PAS positivity was considered when the cell exhibited strong violet coloration in the cytoplasm (indicated by the arrows). Below: Percent of PAS positive cells. Data are means ±SD from at least 3 independent experiments, each bar represents the average of at least 3000 counted cells. *P<0.01 vs. glc, #P<0.01 vs gal, P<0.05 vs Ø.
Figure 4
Figure 4. Lithium elevates stored Ca2+ but does not directly influence basal free Ca2+ levels.
Jurkat cells were incubated in 5 mM glucose or 5 mM galactose containing or hexose-free media for 48 hours, with or without 10 mM lithium. (A) Basal ER Ca2+ levels were measured as the ratio of F340/F380 nm fluorescence of magFura2-AM, in the absence of extracellular Ca2+. *P<0.01 vs. glc, #P<0.01 vs gal, P<0.05 vs Ø. (B) After recording the initial stored Ca2+ levels, 1 µM ionomycin was used to deplete Ca2+ stores. The bars represent the remaining Ca2+ levels after steady-state is reached as a fluorescence ratio of magFura2-AM. *P<0.01 vs. glc, #P<0.05 vs gal, P<0.05 vs Ø. (C) Average basal intracellular free Ca2+ levels ([Ca2+]i) of Jurkat cells. Bars represent the calculated baseline [Ca2+]i concentration of Fura2-AM loaded cells in the absence of extracellular Ca2+. *P<0.01 vs. glc. Data are means ±SD from at least 4 independent experiments.
Figure 5
Figure 5. UPR is greatly activated in Jurkat cells grown on galactose and treated with lithium.
Jurkat cells were incubated in 5 mM glucose or 5 mM galactose containing or hexose-free media for 48, 72 or 96 hours, with or without 10 mM lithium. UPR activation was assessed by the increase of X-box binding protein 1 (XBP) and XBP transcript variant 2 (XBPS) mRNA expressional level. Each bar represent fold increase of relative levels of XBP or XBPS mRNA compared to control (5 mM glc treated for 48 hours) samples. (A) Relative levels of XBP and XBPS mRNA in glucose or glucose + lithium treated cells at the indicated treatment times. (B) Relative levels of XBP and XBPS mRNA in galactose or galactose + lithium treated cells. (C) Relative levels of XBP and XBPS mRNA in fasting or fasting + lithium treated cells. Data are means ±SD from at least 4 independent experiments. *P<0.05 vs. glucose treated cells at the corresponding treatment times, #P<0.05 vs. gal at the corresponding treatment times.
Figure 6
Figure 6. Lithium treated, galactose-fed cells show dose-dependent, apparent increase of O-GlcNAc proteins.
Immunoblotting with CTD110.6 antibody in protein extracts from Jurkat cells. Cells were incubated in 5 mM glucose or 5 mM galactose containing media for 48 hours, with 0, 2.5 or 10 mM lithium. Left: Representative western-blot analysis showing cellular extracts of Jurkat cells separated using SDS-PAGE and labelled with CTD110.6 antibody. Right: Densitometric analysis of CTD110.6 positive bands. Relative levels are expressed as fold increase compared to the control, 5 mM glucose-grown cells. Data are means ±SD from 4 independent experiments after normalized for total protein staining. *P<0.05 vs. glc.
Figure 7
Figure 7. The elevation of O-GlcNAc (CTD110.6-positive) proteins in lithium treated, galactose-grown cells is similar to those of fasting cells.
(A) Western-blot analysis using CTD110.6 antibody and (B) peroxidase-conjugated lectin (WGA) staining (bottom) shows representative samples of protein extracts from Jurkat cells previously incubated for 48 hours in 5 mM glucose, 5 mM galactose or hexose-free media, supplemented with either 0, 2.5 or 10 mM lithium. (C) Left: Representative western-blot analysis using CTD110.6 antibody (top) shows Jurkat samples previously starved or incubated in 5 mM galactose containing media, with or without 10 mM lithium. Cellular extracts were isolated on the 1st, 2nd and 3rd day of the experiment. Right: Densitometric analysis of the total CTD110.6 staining over time. Levels are expressed as a percentage of the baseline intensity. Each data point represents the average of at least 3 separate experiments. In the same order as the samples are presented on the blot from left to right, the numerical mean±SD values are: 0,71(±0,05); 0,79(±0,08); 1,06(±0,03); 1,74(±0,03); 3,59(±0,40); 4,02(±0.47); 2,83(±0.14); 4,95(±0.29); 7,88(±1.44); 7,95(±1.50); 2,26(±0.30); 3,96(±1.26), respectively.
Figure 8
Figure 8. The elevated level of CTD110.6 positive proteins induced by lithium and galactose treatment can be abolished by blocking N-glycan synthesis.
Immunoblot analysis of Jurkat cellular extracts stained with CTD110.6 antibody or peroxidase-conjugated lectin (WGA). Cells were grown in 5 mM glucose or galactose containing medium, with or without 10 mM lithium for 48 hours. Each group was also treated with or without 0,5 µM tunicamycin for the second 24 hours of the experiment. (A) Western blot analysis showing cellular extracts (30 µg/lane) separated using SDS-PAGE and stained with CTD110.6. (B) The same extracts were loaded on a separate SDS-PAGE and stained by peroxidase-conjugated WGA. (C) Western blot analysis showing protein extracts from cells kept in 5 mM glucose containing media and treated with either 5 mM glucosamine, 100 µM PUGNAc or both for 3 hours to increase O-GlcNAc levels. Starting 24 hours earlier and during the experiment 0,5 µM tunicamycin treatment was employed to exclude any N-glycan related changes. Right: Densitometric analysis of CTD110.6 or WGA positive bands. Relative levels are expressed as fold increase compared to the control, 5 mM glucose-grown cells. Data are means ±SD from 3 independent experiments after normalized for total protein staining. *P<0.05 vs. 5 mM glc, #P<0.05 vs. 5 mM gal, P<0.05 vs. 5 mM gal/10 mM Li.
Figure 9
Figure 9. Enzymatically removing N-linked oligosaccharides disrupts elevated CTD110.6 signal in lithium treated, galactose-grown Jurkat cells.
Western-blot analysis showing that CTD 110.6 antibody detects proteins with O-linked GlcNAc and Asn-linked GlcNAc. Western blot analysis showing protein extracts from cells kept in 5 mM glucose or 5 mM galactose and 10 mM lithium containing media for 48 hours. To remove all N-glycan moieties from the extracted proteins, each samples were also subjected to PNGase F digestion before loading. Following SDS-PAGE, PNGAse treated and non-treated samples were stained with either CTD110.6 antibody (A) or WGA (B). Right: Densitometric analysis of CTD110.6 or WGA positive bands. Relative levels are expressed as fold increase compared to the control, 5 mM glucose-grown cells. Data are means ±SD from 3 independent experiments after normalized for total protein staining. *P<0.05 vs. 5 mM glc, #P<0.05 vs. 5 mM gal/10 mM Li.

Similar articles

Cited by

References

    1. Acosta PB, Gross KC (1995) Hidden sources of galactose in the environment. Eur J Pediatr 154: : S87–92. Available:http://www.ncbi.nlm.nih.gov/pubmed/7671974. Accessed 21 March 2012. - PubMed
    1. Vannucci SJ, Maher F, Simpson I a (1997) Glucose transporter proteins in brain: delivery of glucose to neurons and glia. Glia 21: : 2–21. Available:http://www.ncbi.nlm.nih.gov/pubmed/9298843. Accessed 1 August 2011. - PubMed
    1. Berry GT, Nissim I, Lin Z, Mazur AT, Gibson JB, et al.. (1995) Endogenous synthesis of galactose in normal men and patients with hereditary galactosaemia. Lancet 346: : 1073–1074. Available:http://www.ncbi.nlm.nih.gov/pubmed/7564790. Accessed 21 March 2012. - PubMed
    1. Lorenzi M (2007) The polyol pathway as a mechanism for diabetic retinopathy: attractive, elusive, and resilient. Exp Diabetes Res 2007: 61038. Available:http://www.pubmedcentral.nih.gov/articlerender.fcgi?artid=1950230&tool=p.... Accessed 6 March 2012. - PMC - PubMed
    1. Masuda CA, Xavier MA, Mattos KA, Galina A, Montero-Lomeli M (2001) Phosphoglucomutase is an in vivo lithium target in yeast. J Biol Chem 276: : 37794–37801. Available:http://www.ncbi.nlm.nih.gov/pubmed/11500487. Accessed 21 March 2012. - PubMed

Publication types

MeSH terms