

Detection of deregulated modules using deregulatory linked path
- PMID: 23894653
- PMCID: PMC3722188
- DOI: 10.1371/journal.pone.0070412
Detection of deregulated modules using deregulatory linked path
Abstract
The identification of deregulated modules (such as induced by oncogenes) is a crucial step for exploring the pathogenic process of complex diseases. Most of the existing methods focus on deregulation of genes rather than the links of the path among them. In this study, we emphasize on the detection of deregulated links, and develop a novel and effective regulatory path-based approach in finding deregulated modules. Observing that a regulatory pathway between two genes might involve in multiple rather than a single path, we identify condition-specific core regulatory path (CCRP) to detect the significant deregulation of regulatory links. Using time-series gene expression, we define the regulatory strength within each gene pair based on statistical dependence analysis. The CCRPs in regulatory networks can then be identified using the shortest path algorithm. Finally, we derive the deregulated modules by integrating the differential edges (as deregulated links) of the CCRPs between the case and the control group. To demonstrate the effectiveness of our approach, we apply the method to expression data associated with different states of Human Epidermal Growth Factor Receptor 2 (HER2). The experimental results show that the genes as well as the links in the deregulated modules are significantly enriched in multiple KEGG pathways and GO biological processes, most of which can be validated to suffer from impact of this oncogene based on previous studies. Additionally, we find the regulatory mechanism associated with the crucial gene SNAI1 significantly deregulated resulting from the activation of HER2. Hence, our method provides not only a strategy for detecting the deregulated links in regulatory networks, but also a way to identify concerning deregulated modules, thus contributing to the target selection of edgetic drugs.
Conflict of interest statement
Figures

 and
and  are constructed. Centered on the seed gene ‘g10’, which is colored by yellow, the two regulatory subsystems
  and
and  are extracted. The deregulated module is derived by integrating the differential edges of the CCRPs. Here, the CCRP from ‘g4’ to ‘g11’ is switched. In the control group, the CCRP is ‘g4→g7→g10→g11’. While in the case group, it is ‘g4→g10→g16→g11’.
 -
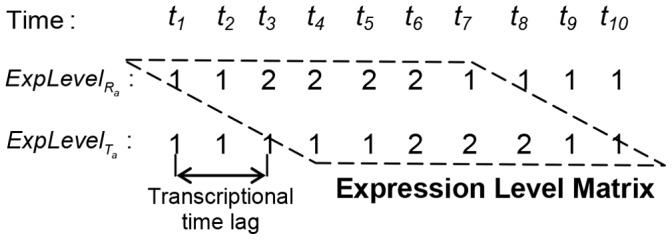
- gene pair, the time points of the initial changes in their expression of the control group are
  and
and  , respectively. Thus, the transcriptional time lag is
  .
.
 and
and  is 3 time unit. After discretizing the expression of the gene pair, we organize
  and
and  into the expression level matrix, where the expression level of
  at time point
  is aligned with the expression level of
  at time point
  .
.


Similar articles
-
A link partition approach for finding overlapping functional modules in the transcriptional regulatory network.Biomed Mater Eng. 2014;24(6):3719-27. doi: 10.3233/BME-141200. Biomed Mater Eng. 2014. PMID: 25227087
-
Identification of regulatory modules in genome scale transcription regulatory networks.BMC Syst Biol. 2017 Dec 15;11(1):140. doi: 10.1186/s12918-017-0493-2. BMC Syst Biol. 2017. PMID: 29246163 Free PMC article.
-
Identifying Functional Modules in Co-Regulatory Networks Through Overlapping Spectral Clustering.IEEE Trans Nanobioscience. 2018 Apr;17(2):134-144. doi: 10.1109/TNB.2018.2805846. IEEE Trans Nanobioscience. 2018. PMID: 29870337
-
Prioritization of gene regulatory interactions from large-scale modules in yeast.BMC Bioinformatics. 2008 Jan 22;9:32. doi: 10.1186/1471-2105-9-32. BMC Bioinformatics. 2008. PMID: 18211684 Free PMC article.
-
Challenges for modeling global gene regulatory networks during development: insights from Drosophila.Dev Biol. 2010 Apr 15;340(2):161-9. doi: 10.1016/j.ydbio.2009.10.032. Epub 2009 Oct 27. Dev Biol. 2010. PMID: 19874814 Review.
Cited by
-
Variance component score test for time-course gene set analysis of longitudinal RNA-seq data.Biostatistics. 2017 Oct 1;18(4):589-604. doi: 10.1093/biostatistics/kxx005. Biostatistics. 2017. PMID: 28334305 Free PMC article.
-
Time-Course Gene Set Analysis for Longitudinal Gene Expression Data.PLoS Comput Biol. 2015 Jun 25;11(6):e1004310. doi: 10.1371/journal.pcbi.1004310. eCollection 2015 Jun. PLoS Comput Biol. 2015. PMID: 26111374 Free PMC article.
-
A novel network analysis approach reveals DNA damage, oxidative stress and calcium/cAMP homeostasis-associated biomarkers in frontotemporal dementia.PLoS One. 2017 Oct 11;12(10):e0185797. doi: 10.1371/journal.pone.0185797. eCollection 2017. PLoS One. 2017. PMID: 29020091 Free PMC article.
References
-
- Ideker T, Ozier O, Schwikowski B, Siegel AF (2002) Discovering regulatory and signalling circuits in molecular interaction networks. Bioinformatics (Suppl. 1): S233–S240. - PubMed
-
- Nacu S, Critchley-Thorne R, Lee P, Holmes S (2007) Gene expression network analysis and applications to immunology. Bioinformatics 23: 850–858. - PubMed
-
- Ulitsky I, Karp RM, Shamir R (2008) Detecting disease-specific dysregulated pathways via analysis of clinical expression profiles. Research in Computational Molecular Biology 4955: 347–359.
Publication types
MeSH terms
Substances
LinkOut - more resources
Full Text Sources
Other Literature Sources
Research Materials
Miscellaneous
