. 2013 Jul 29:14:516.
doi: 10.1186/1471-2164-14-516.

Genome-wide upstream motif analysis of Cryptosporidium parvum genes clustered by expression profile

Affiliations

Genome-wide upstream motif analysis of Cryptosporidium parvum genes clustered by expression profile

Jenna Oberstaller et al. BMC Genomics. .

Abstract

Background: There are very few molecular genetic tools available to study the apicomplexan parasite Cryptosporidium parvum. The organism is not amenable to continuous in vitro cultivation or transfection, and purification of intracellular developmental stages in sufficient numbers for most downstream molecular applications is difficult and expensive since animal hosts are required. As such, very little is known about gene regulation in C. parvum.

Results: We have clustered whole-genome gene expression profiles generated from a previous study of seven post-infection time points of 3,281 genes to identify genes that show similar expression patterns throughout the first 72 hours of in vitro epithelial cell culture. We used the algorithms MEME, AlignACE and FIRE to identify conserved, overrepresented DNA motifs in the upstream promoter region of genes with similar expression profiles. The most overrepresented motifs were E2F (5'-TGGCGCCA-3'); G-box (5'-G.GGGG-3'); a well-documented ApiAP2 binding motif (5'-TGCAT-3'), and an unknown motif (5'-[A/C] AACTA-3'). We generated a recombinant C. parvum DNA-binding protein domain from a putative ApiAP2 transcription factor [CryptoDB: cgd8_810] and determined its binding specificity using protein-binding microarrays. We demonstrate that cgd8_810 can putatively bind the overrepresented G-box motif, implicating this ApiAP2 in the regulation of many gene clusters.

Conclusion: Several DNA motifs were identified in the upstream sequences of gene clusters that might serve as potential cis-regulatory elements. These motifs, in concert with protein DNA binding site data, establish for the first time the beginnings of a global C. parvum gene regulatory map that will contribute to our understanding of the development of this zoonotic parasite.


Figures
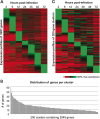
Figure 1
Figure 1
In vitro C. parvum gene expression 0-72hr post-infection. A. Expression profiles of the 3,281 genes used in our study were sorted according to peak expression at each time point. Each row represents the expression profile of a single gene at 2, 6, 12, 24, 36, 48 and 72 hr post-infection. B. Distribution of genes per cluster. Of the 3,281 genes used in this study, we were able to cluster 2,949 into 200 clusters. Clusters range in size from 3 to 52 genes, with an average of 14.7 genes and a median of 13 genes per cluster. C. Expression profiles of a representative gene from each of the 200 clusters identified using FCM analysis. Each of the 200 rows in the heat map represents a single cluster. Genes were sorted according to peak expression at each time point.
Figure 2
Figure 2
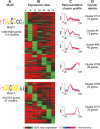
Data supporting identification of AP2_1-like motifs. A. AP2_1-like motifs. Motif name and total number of genes possessing each motif per total genes in all clusters where the motif is overrepresented are indicated. B. Expression data for 2, 6, 12, 24, 36, 48 and 72 hours post-infection for all genes from each cluster where the motif is overrepresented. Each row indicates a gene; rows are sorted first by cluster, then by peak expression at each time point. Gene IDs for genes associated with each cluster can be found in Additional file 1: Table S2. Expression is indicated on a scale of 0-100% of max for each gene. C. Seven representative cluster profiles selected from the 55 clusters containing overrepresented AP2_1-like motifs. Line colors for individual gene profiles indicate the membership values of that gene profile to the cluster ranging from 0.5 to 1. Each cluster profile is located next to the corresponding rows in the gene expression heatmap. D. Cluster number and total number of genes in each displayed representative cluster.
Figure 3
Figure 3
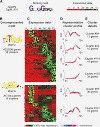
Data supporting identification of a G-box-binding ApiAP2 and G-box-like motifs. A. Binding motif for ApiAP2 domain Cgd8_810 as determined by protein-binding microarray. Cgd8_810 expression data for 2, 6, 12, 24, 36, 48 and 72 hours post-infection are indicated. B. Identified G-box-like motifs overrepresented in cluster upstream regions. Motif name and total number of genes possessing each motif per total genes in all clusters where the motif is overrepresented are indicated. C. Expression data for all genes from each cluster where the motif is overrepresented. Each row indicates a gene; rows are sorted first by cluster, then by peak expression at each time point. Gene IDs for genes associated with each cluster can be found in Additional file 1: Table S2. Expression is indicated on a scale of 0-100% of max for each gene. D. Six representative cluster profiles selected from the 54 clusters containing overrepresented G-box-like motifs. Line colors for individual gene profiles indicate the membership values of that gene profile to the cluster ranging from 0.5 to 1. Each cluster profile is located next to the corresponding rows in the gene expression heatmap. E. Cluster number and total number of genes in each displayed representative cluster.
Figure 4
Figure 4
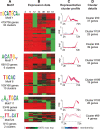
Data supporting identification of E2F-like motifs. A. E2F-like motifs. Motif name and total number of genes possessing each motif per total genes in all clusters where the motif is overrepresented are indicated. B. Expression data for 2, 6, 12, 24, 36, 48 and 72 hours post-infection for all genes from each cluster where the motif is overrepresented. Each row indicates a gene; rows are sorted first by cluster, then by peak expression at each time point. Gene IDs for genes associated with each cluster can be found in Additional file 1: Table S2. Expression is indicated on a scale of 0-100% of max for each gene. C. Six representative cluster profiles selected from the 161 clusters containing overrepresented E2F-like motifs. Line colors for individual gene profiles indicate the membership values of that gene profile to the cluster ranging from 0.5 to 1. Each cluster profile is located next to the corresponding rows in the gene expression heatmap. D. Cluster number and total number of genes in each displayed representative cluster.
Figure 5
Figure 5
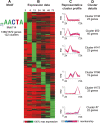
Data supporting identification of Unknown motif 14. A. Unknown motif 14. Total number of genes possessing the motif per total genes in all clusters where the motif is overrepresented is indicated. B. Expression data for 2, 6, 12, 24, 36, 48 and 72 hours post-infection for all genes from each cluster where the motif is overrepresented. Each row indicates a gene; rows are sorted first by cluster, then by peak expression at each time point. Gene IDs for genes associated with each cluster can be found in Additional file 1: Table S2. Expression is indicated on a scale of 0-100% of max for each gene. C. Six representative cluster profiles selected from the 122 clusters containing overrepresented Unknown motif 14. Line colors for individual gene profiles indicate the membership values of that gene profile to the cluster ranging from 0.5 to 1. Each cluster profile is located next to the corresponding rows in the gene expression heatmap. D. Cluster number and total number of genes in each displayed representative cluster.
Figure 6
Figure 6
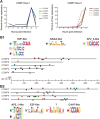
Overrepresented motifs upstream of ribosomal protein genes in P. falciparum and C. parvum. A. Expression profiles for 68 P. falciparum (Pf) co-expressed IDC ribosomal proteins (data from Bozdech et al. 2003). B. Expression profiles for 25 C. parvum (Cp) co-expressed ribosomal proteins from clusters #6, #20 and #35. Five representative upstream regions are shown for each organism out of 68 Pf and 60 Cp respectively. Upstream regions for each of these genes were mined for overrepresented motifs (see Materials and Methods). As previously documented, the upstream regions of Pf ribosomal proteins contain overrepresented G-box motifs (Essien and Stoeckert, 2010). Cp ribosomal proteins have E2F-like and GAGA-like motifs overrepresented upstream.
Figure 7
Figure 7
Overrepresented motifs upstream of COWPs by subclass. A. Expression profiles of Class I and Class II COWPs. The five COWPs that fall into Class 1 peak at 48 hrs post-infection and then decline. The remaining four Class II COWPs begin rising at 48 hrs and peak at 72 hrs. B1. The upstream regions of each of the Class I COWPs contain five overrepresented motifs that fall into three groups. Upstream regions for each of these genes were mined for overrepresented motifs (see Materials and Methods). Three motifs overrepresented upstream of Class I COWPs are closely related to E2F binding sites. A GAGA-like motif and an ApiAP2 motif identified in P. falciparum (Campbell et al. 2010; here we designate this motif AP2_2) are also overrepresented upstream of Class I COWPs. B2. The upstream regions of each of the Class II COWPs contain five overrepresented motifs. Two motifs are similar to a documented ApiAP2 binding site across apicomplexans. E2F-like and CCAAT-box-like motifs are also overrepresented. The remaining motif is unknown and does not appear related to any of the 25 motifs identified in this study.
Figure 8
Figure 8
Overrepresented motifs upstream of genes in clusters peaking primarily at 72 hrs post-infection. A. Clusters peaking primarily at 72 hrs post-infection. B. Overrepresented motifs upstream of genes in these clusters. Nine representative upstream regions are shown out of 105 searched. Upstream regions for each of these genes were mined for overrepresented motifs (see Materials and Methods). The upstream regions of genes in clusters peaking primarily at 72 hours share four overrepresented motifs. Two of these motifs are similar to previously identified ApiAP2 binding sites. One binding site is E2F-like. The remaining site is similar to the G-box noted in other apicomplexans, which we have demonstrated is an ApiAP2 binding site in C. parvum.

Similar articles

Cited by

References

    1. Navin TR, Hardy AM. Cryptosporidiosis in patients with AIDS. J Infect Dis. 1987;155(1):150. doi: 10.1093/infdis/155.1.150. - DOI - PubMed
    1. Tzipori S. Cryptosporidiosis in perspective. Adv Parasitol. 1988. pp. 63–129. - PMC - PubMed
    1. Spano F, Crisanti A. Cryptosporidium parvum: the many secrets of a small genome. Int J Parasitol. 2000;30(4):553–565. doi: 10.1016/S0020-7519(99)00188-5. - DOI - PubMed
    1. Kotloff KL, Nataro JP, Blackwelder WC, Nasrin D, Farag TH, Panchalingam S, Wu Y, Sow SO, Sur D, Breiman RF, Burden and aetiology of diarrhoeal disease in infants and young children in developing countries (the Global Enteric Multicenter Study, GEMS): a prospective, case–control study. Lancet. 2013. - PubMed
    1. Campbell PN, Current WL. Demonstration of serum antibodies to Cryptosporidium sp. in normal and immunodeficient humans with confirmed infections. J Clin Microbiol. 1983;18(1):165–169. - PMC - PubMed

Publication types

Substances

LinkOut - more resources