. 2013 Nov 1;442(1):83-96.
doi: 10.1016/j.ab.2013.07.021. Epub 2013 Jul 27.

Radiative decay engineering 6: fluorescence on one-dimensional photonic crystals

Affiliations

Radiative decay engineering 6: fluorescence on one-dimensional photonic crystals

Ramachandram Badugu et al. Anal Biochem. .

Abstract

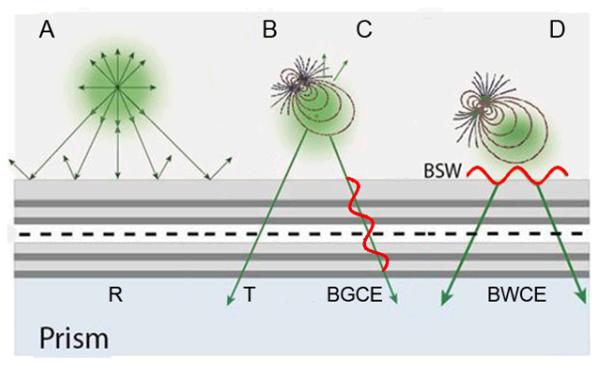
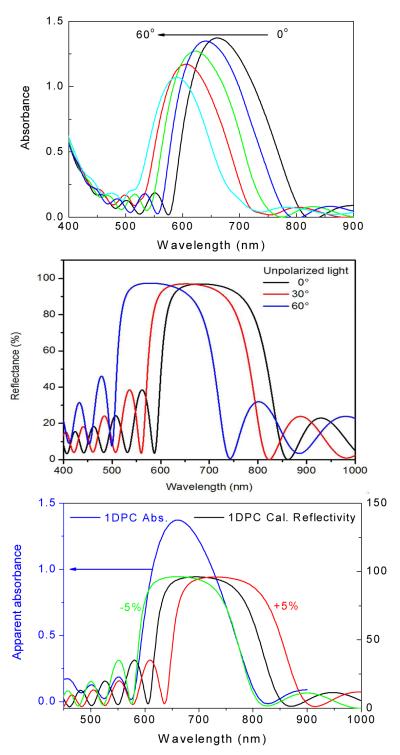
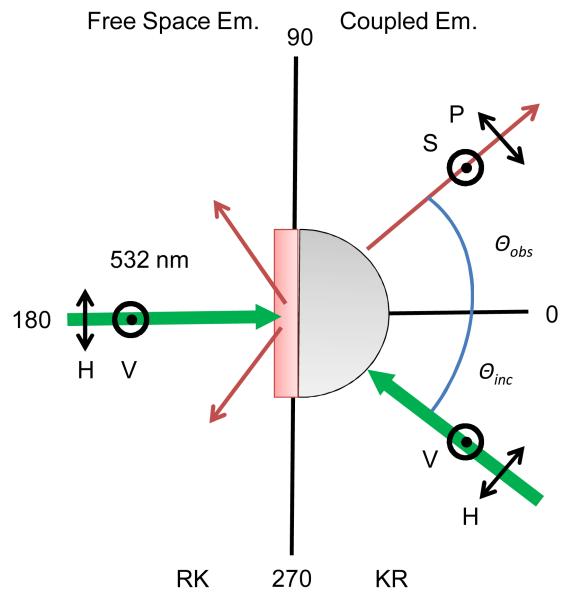
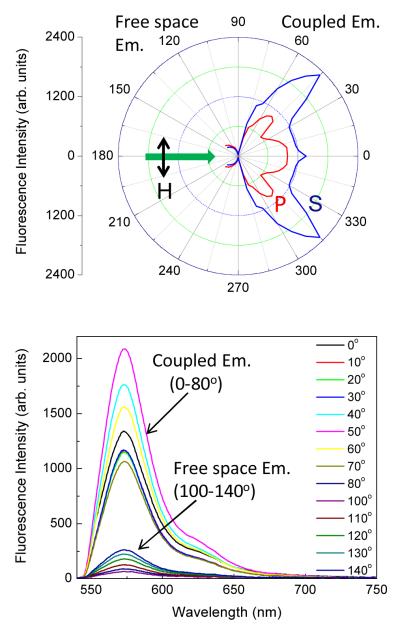
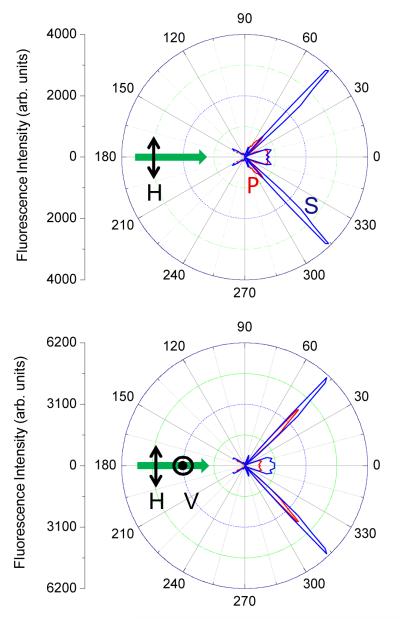
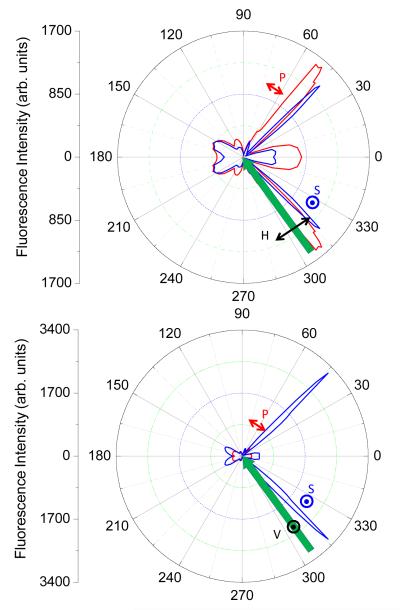
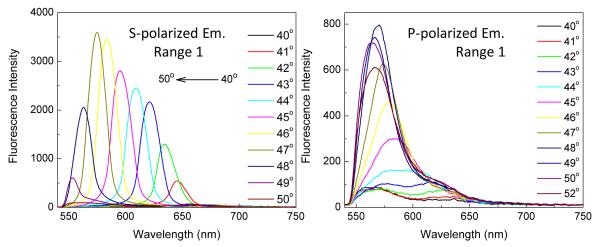
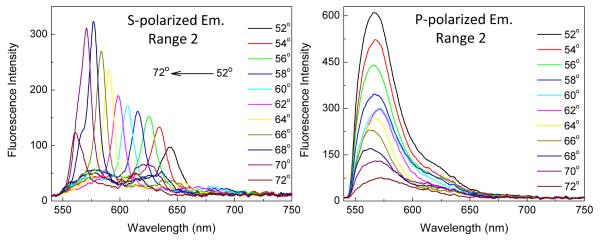
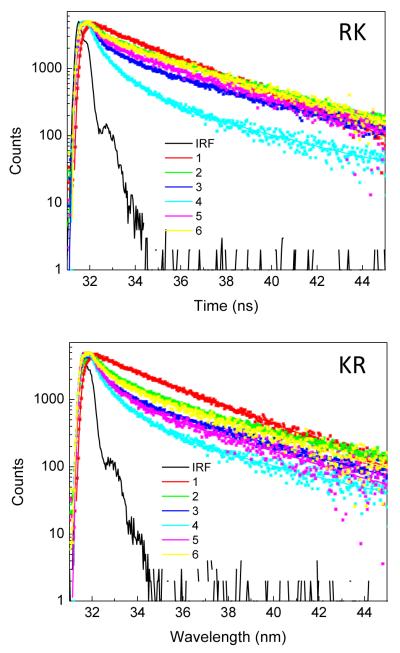
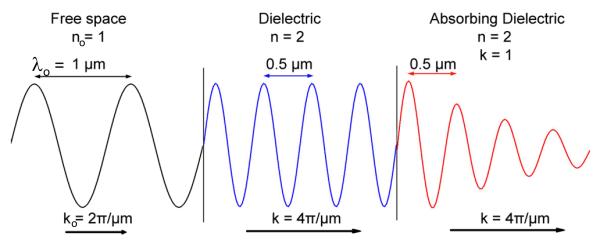
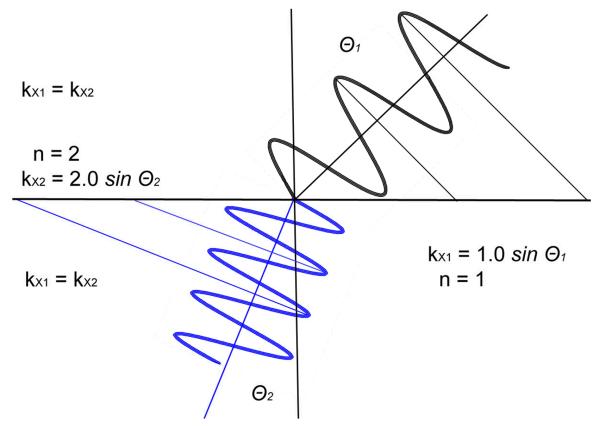
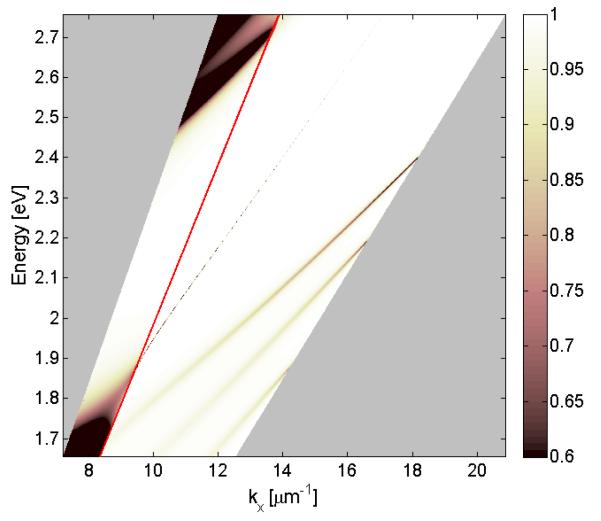
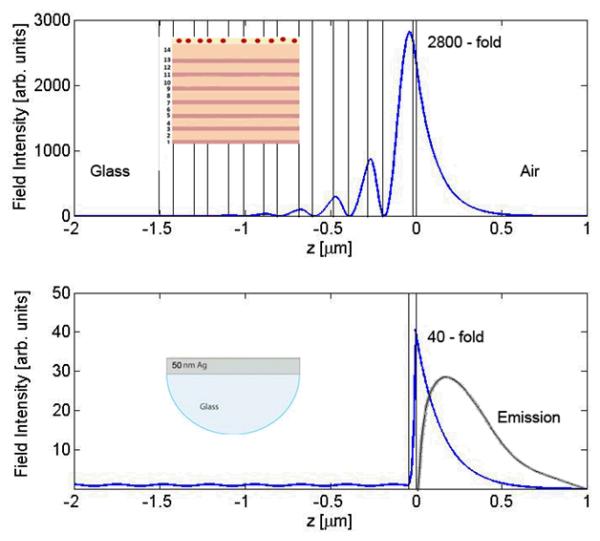
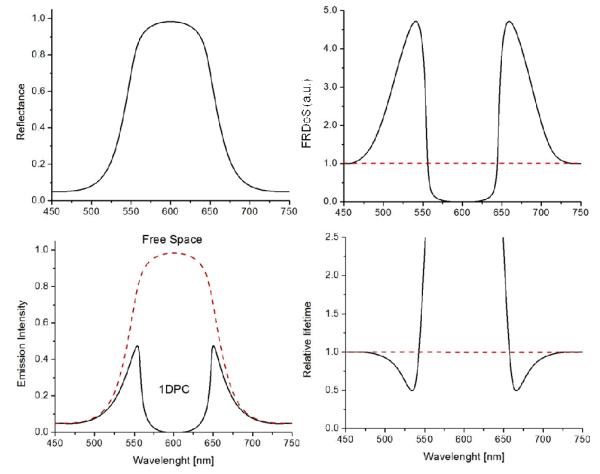
During the past decade the interactions of fluorophores with metallic particles and surfaces has become an active area of research. These near-field interactions of fluorophores with surface plasmons have resulted in increased brightness and directional emission. However, using metals has some disadvantages such as quenching at short fluorophore-metal distances and increased rates of energy dissipation due to lossy metals. These unfavorable effects are not expected in dielectrics. In this article, we describe the interactions of fluorophores with one-dimensional (1D) photonic crystals (PCs), which have alternating layers of dielectrics with dimensions that create a photonic band gap (PBG). Freely propagating light at the PBG wavelength will be reflected. However, similar to metals, we show that fluorophores within near-field distances of the 1DPC interacts with the structure. Our results demonstrate that these fluorophores can interact with both internal modes and Bloch surface waves (BSWs) of the 1DPC. For fluorophores on the surface of the 1DPC, the emission dominantly occurs through the 1DPC and into the substrate. We refer to these two phenomena together as Bragg grating-coupled emission (BGCE). Here we describe our preliminary results on BGCE. 1DPCs are simple to fabricate and can be handled and reused without damage. We believe that BGCE provides opportunities for new formats for fluorescence detection and sensing.

Keywords: Bragg grating-coupled emission; Near-field interactions; One-dimensional photonic crystals; Photonic band gap; Radiative decay engineering; Surface plasmon-coupled emission.


Figures

Figure 1
Figure 1
Schematic of a fluorophore interacting with a 1DPC. Depending upon conditions the emission can be reflected (A), transmitted (B), transmitted by coupling with internal BG modes (C) or transmitted by interaction with BSWs (D). The dash line is free space behavior.
Figure 2
Figure 2
Expected spatial distribution of the Bragg grating-coupled emission.
Figure 3
Figure 3
Schematic of the SiO2 - Si3N4 multilayer 1DPC and the measured optical constants. Also shown is the final PVA layer which contains RhB.
Figure 4
Figure 4
Real color photograph of our 1DPC in white light on a printed page to demonstrate optical clarity (top). The lower panel shows photographs of the samples on adjacent white or red background at normal (0 degree) and 60 degree observation.
Figure 5
Figure 5
Absorption spectra (top) and calculated reflectivity (middle) of the 1DPC at various angles of incidence. The lower panel shows the effect of increasing or decreasing the thickness of all layers by 5% on the calculated reflectivity.
Figure 6
Figure 6
Experimental geometry and polarization used with the 1DPC.
Figure 7
Figure 7
RhB in PVA emission on glass. Top, angular distribution. Bottom, H-illumination S-polarized emission spectra from coupled (0 to 80°) and free space (100 to 140°) angles.
Figure 8
Figure 8
Top, Angular distribution of RhB S- and P-polarized emission with RK excitation. Bottom, S-polarized emission for RhB on 1DPC where the red and blue lines are using H- and V-polarized excitation, respectively. The distribution of S-polarized or P-polarized emissions are similar with V- or H-polarized incident light.
Figure 9
Figure 9
Angular distribution of RhB S- and P-polarized emission with KR excitation. Top, H-polarized excitation. Bottom V-polarized excitation.
Figure 10
Figure 10
Effect of observation angle in Range 1 (40-52 degree) on the RhB emission spectra with V-polarized RK excitation for S-polarized (left) and P-polarized emission (right).
Figure 11
Figure 11
Effect of observation angle in Range 2 (52-72 degree) on the RhB emission spectra with V-polarized RK excitation for S-polarized (left) and P-polarized emission (right).
Figure 12
Figure 12
RhB intensity decays with RK (top) and KR (bottom) illumination. RhB on glass (1), RhB on IDPC for P- (2) and S-polarized (3) emission at 44 degree observation angle (Range 1). Traces (4) and (5) are corresponding P- and S- polarized emissions at 64 degree angle (Range 2). Trace 6 is for RhB free space emission at 120 degree angle. Also shown in the figures is instrument response function (IRF).
Figure 13
Figure 13
Top, Calculated angle-dependent reflectivity for the 1DPC shown in Figure 2. For all simulations we used nL = 1.46, kL = 1×10⁻⁵, nH = 2.14, kH = 3×10⁻⁴, nPVA = 1.46, kPVA = 1×10⁻⁵. Bottom, calculated reflectivity with different assumed values of the refractive indices of the top layer 45 nm thick.
Figure 14
Figure 14
Illumination-induced electric field intensity (∣E2∣) calculated for the 1DPC shown in Figure 2.
Figure 15
Figure 15
Dispersion diagram for the 1DPC shown in Figure 2. The figure shows the reflectivity for a range of wavelengths and incidence angles. The dots represent the emission maxima and respective angles from Figures 10 (left) and 11 (left).
Figure 16
Figure 16
Angle-dependent reflectivity spectra from the dispersion plot shown in Figure 15.
Figure 17
Figure 17
Schematic of a 1 μm wave in various media with different optical constants.
Figure 18
Figure 18
Wave vector matching across an interface.
Figure 19
Figure 19
General dispersion diagram for the 1DPC shown in Figure 2. The reflectivity is shown for the area presented in Figure 15. The two areas with a pattern are outside Figure 15.
Figure 20
Figure 20
Comparison of the light induced fields with BSWs (top) and with a silver film (bottom).
Figure 21
Figure 21
Schematic of the effects of the Fractional Radiative Density-of-States on fluorophores.

References

    1. Lakowicz JR, Ray K, Chowdhury M, Szmacinski H, Fu Y, Zhang J, Nowaczyk K. Plasmon-controlled fluorescence: a new paradigm in fluorescence spectroscopy. Analyst. 2008;133:1308–1346. - PMC - PubMed
    1. Deng W, Goldys EM. Plasmonic approach to enhanced fluorescence for applications in biotechnology and the life sciences. Langmuir. 2012;28:10152–10163. - PubMed
    1. Lakowicz JR. Radiative decay engineering 5: Metal-enhanced fluorescence and plasmon emission. Anal. Biochem. 2005;337:171–194. - PMC - PubMed
    1. Cao S-H, Cai W-P, Liu Q, Li Y-Q. Surface plasmon-coupled emission: What can directional fluorescence bring to the analytical sciences? Annu. Rev. Anal. Chem. 2012;5:317–36. - PubMed
    1. Lai C-F, Kuo H-C, Yu P, Lu T-C, Chao C-H, Yen H-H, Yeh W-Y. Highly-directional emission patterns based on near single guided mode extraction from GaN-based ultrathin microcavity light-emitting diodes with photonic crystals. Appl. Phys. Letts. 2010;97:0131808–1/3.

Publication types