

Bacterial resistance studies using in vitro dynamic models: the predictive power of the mutant prevention and minimum inhibitory antibiotic concentrations
- PMID: 23896481
- PMCID: PMC3811419
- DOI: 10.1128/AAC.00578-13
Bacterial resistance studies using in vitro dynamic models: the predictive power of the mutant prevention and minimum inhibitory antibiotic concentrations
Abstract
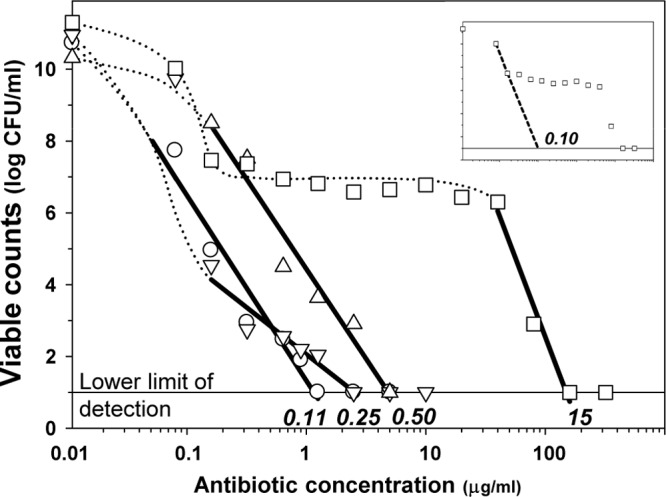
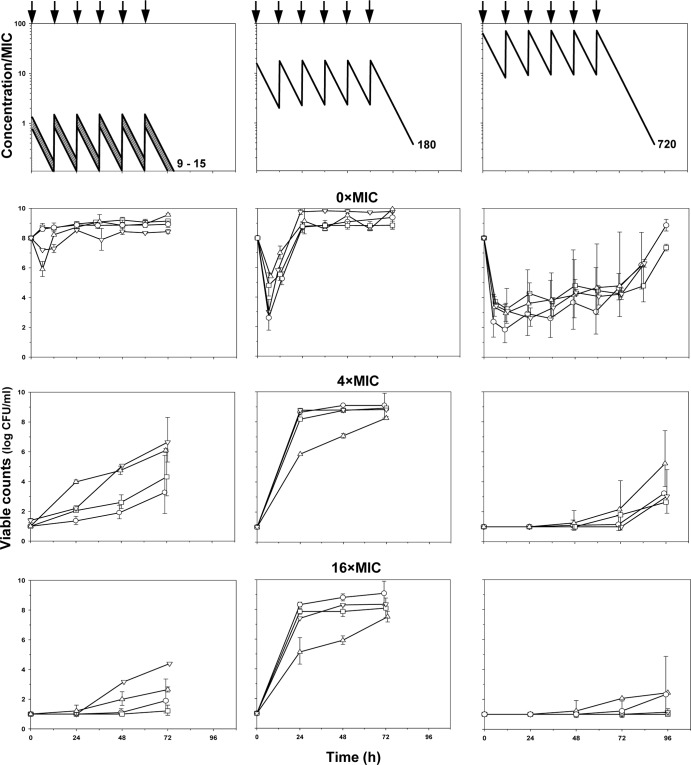
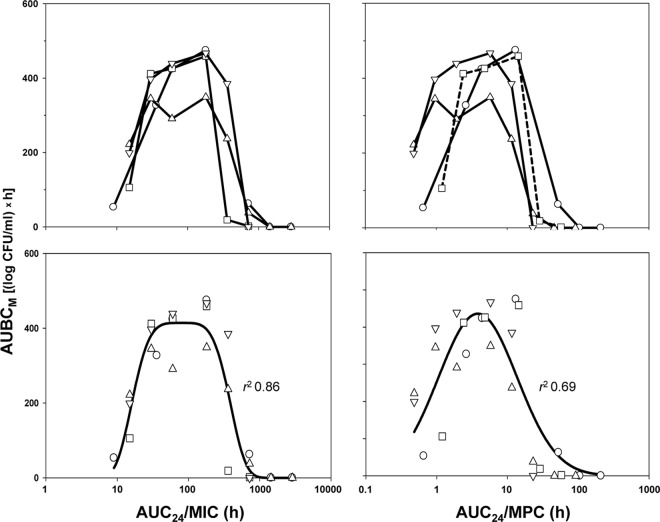
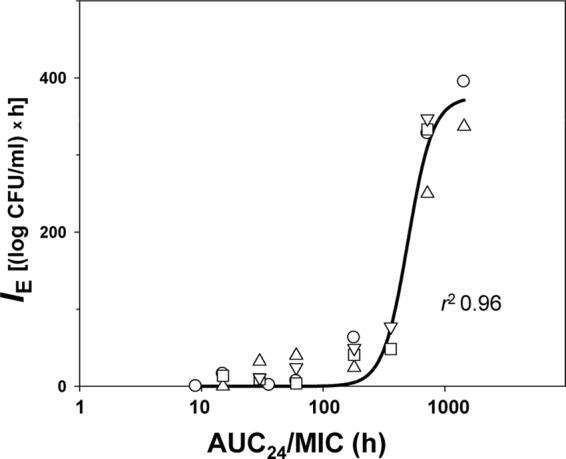
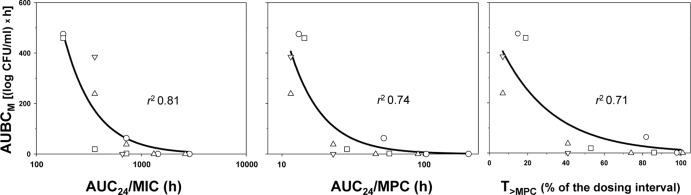
In light of the concept of the mutant selection window, i.e., the range between the MIC and the mutant prevention concentration (MPC), MPC-related pharmacokinetic indices should be more predictive of bacterial resistance than the respective MIC-related indices. However, experimental evidence of this hypothesis remains limited and contradictory. To examine the predictive power of the ratios of the area under the curve (AUC24) to the MPC and the MIC, the selection of ciprofloxacin-resistant mutants of four Escherichia coli strains with different MPC/MIC ratios was studied. Each organism was exposed to twice-daily ciprofloxacin for 3 days at AUC24/MIC ratios that provide peak antibiotic concentrations close to the MIC, between the MIC and the MPC, and above the MPC. Resistant E. coli was intensively enriched at AUC24/MPCs from 1 to 10 h (AUC24/MIC from 60 to 360 h) but not at the lower or higher AUC24/MPC and AUC24/MIC ratios. AUC24/MPC and AUC24/MIC relationships of the areas under the time courses of ciprofloxacin-resistant E. coli (AUBCM) were bell-shaped. A Gaussian-like function fits the AUBCM-AUC24/MPC and AUBCM-AUC24/MIC data combined for all organisms (r(2) = 0.69 and 0.86, respectively). The predicted anti-mutant AUC24/MPC ratio was 58 ± 35 h, and the respective AUC24/MIC ratio was 1,080 ± 416 h. Although AUC24/MPC was less predictive of strain-independent E. coli resistance than AUC24/MIC, the established anti-mutant AUC24/MPC ratio was closer to values reported for Staphylococcus aureus (60 to 69 h) than the respective AUC24/MIC ratio (1,080 versus 200 to 240 h). This implies that AUC24/MPC might be a better interspecies predictor of bacterial resistance than AUC24/MIC.
Figures
References
-
- Firsov AA, Smirnova MV, Strukova EN, Vostrov SN, Portnoy YA, Zinner SH. 2008. Enrichment of resistant Staphylococcus aureus at ciprofloxacin concentrations simulated within the mutant selection window: bolus versus continuous infusion. Int. J. Antimicrob. Agents 32:488–493 - PubMed
-
- Liang B, Bai N, Cai Y, Wang R, Drlica K, Zhao X. 2011. Mutant prevention concentration-based pharmacokinetic/pharmacodynamic indices as dosing targets for suppressing the enrichment of levofloxacin-resistant subpopulations of Staphylococcus aureus. Antimicrob. Agents Chemother. 55:2409–2412 - PMC - PubMed
-
- Olofsson SK, Marcusson LL, Lindgren PK, Hughes D, Cars O. 2006. Selection of ciprofloxacin resistance of Escherichia coli in an in vitro kinetic model: relation between drug exposure and mutant prevention concentration. J. Antimicrob. Chemother. 57:1116–1121 - PubMed
-
- Croisier D, Etienne M, Piroth L, Bergoin E, Lequeu C, Portier H, Chavanet P. 2004. Iin vivo pharmacodynamics efficacy of gatifloxacin against Streptococcus pneumoniae in an experimental model of pneumonia: impact of the low levels of fluoroquinolone resistance on the enrichment of resistant mutants. J. Antimicrob. Chemother. 54:640–647 - PubMed
MeSH terms
Substances
LinkOut - more resources
Full Text Sources
Other Literature Sources
Medical
