. 2014 Jul;63(7):1069-80.
doi: 10.1136/gutjnl-2013-304909. Epub 2013 Jul 29.

AIEC pathobiont instigates chronic colitis in susceptible hosts by altering microbiota composition

Affiliations

AIEC pathobiont instigates chronic colitis in susceptible hosts by altering microbiota composition

Benoit Chassaing et al. Gut. 2014 Jul.

Abstract

Background: Inflammatory bowel disease (IBD) is driven by a seemingly aberrant immune response to the gut microbiota with disease development dictated by genetics and environmental factors. A model exemplifying this notion is our recent demonstration that colonisation of adherent-invasive Escherichia coli (AIEC) during microbiota acquisition drove chronic colitis in mice lacking the flagellin receptor TLR5 (T5KO). T5KO colitis persisted beyond AIEC clearance and requires TLR4 and the NLRC4 inflammasome. We hypothesised that AIEC instigates chronic inflammation by increasing microbial lipopolysaccharide (LPS) and flagellin levels.

Goal: Examine if transient AIEC colonisation lastingly alters levels of LPS and flagellin and changes microbiota composition.

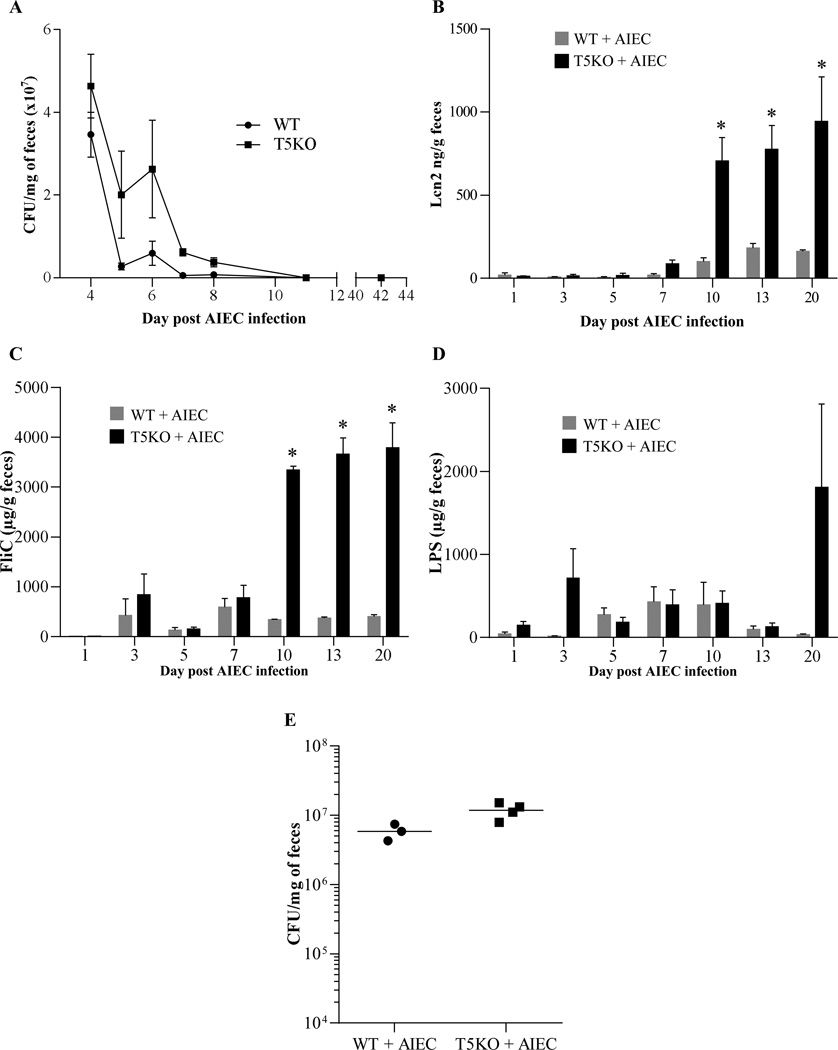
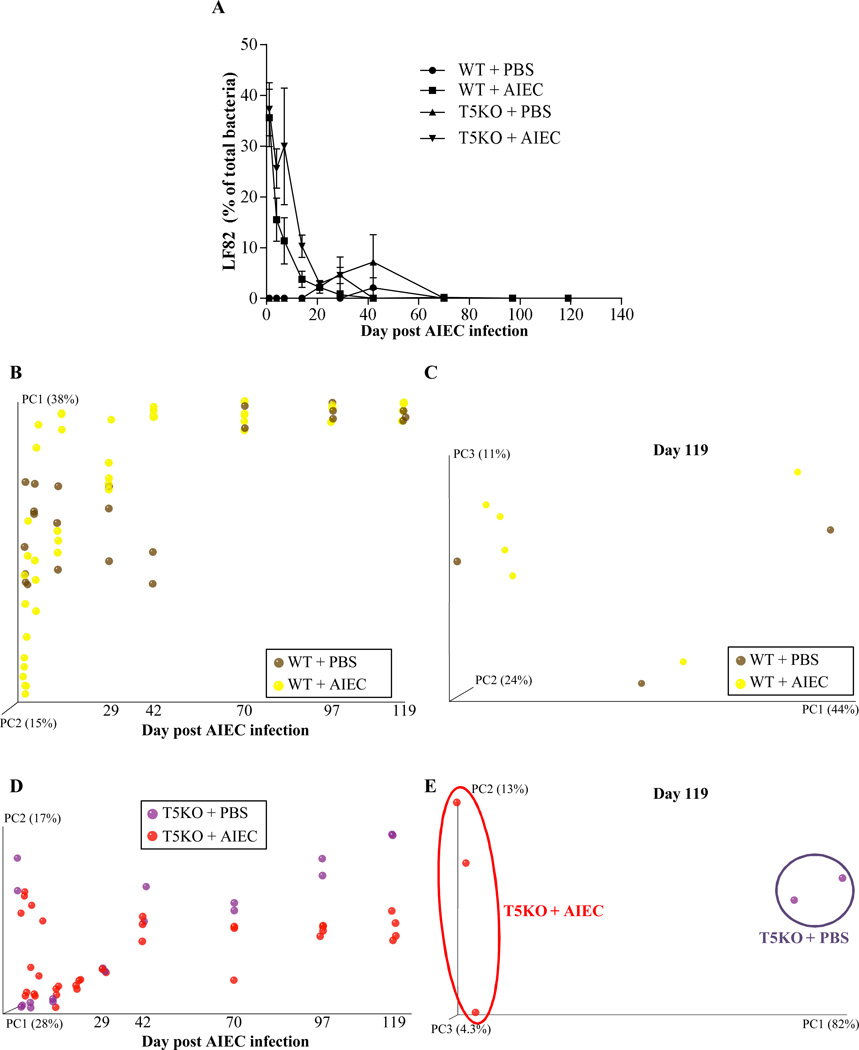
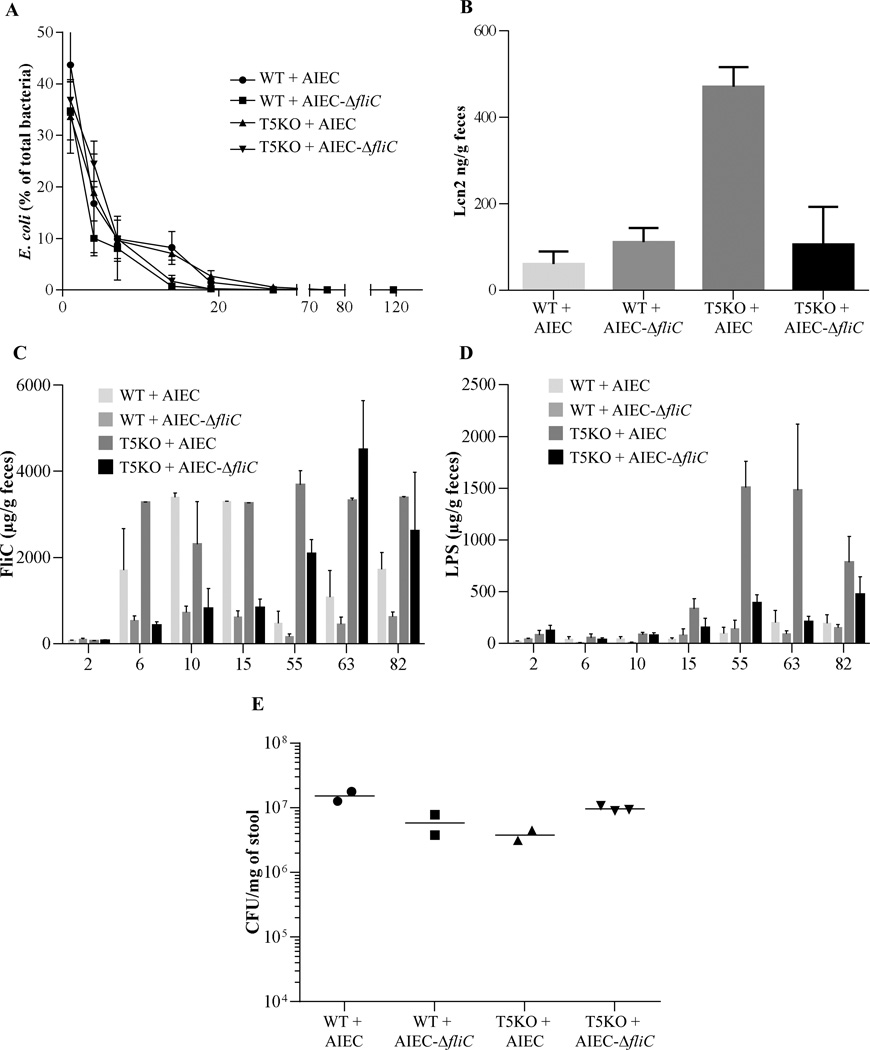
Methods: Germ-free mice (wild type (WT) and T5KO) were inoculated with AIEC strain LF82 and placed in standard housing allowing a complex microbiota that eliminated AIEC in both mice strains. Faeces were assayed for the inflammatory marker, lipocalin-2, bacterial loads, and microbiota composition by pyrosequencing. Faecal LPS and flagellin bioactivity were measured via a cell-based reporter assay.

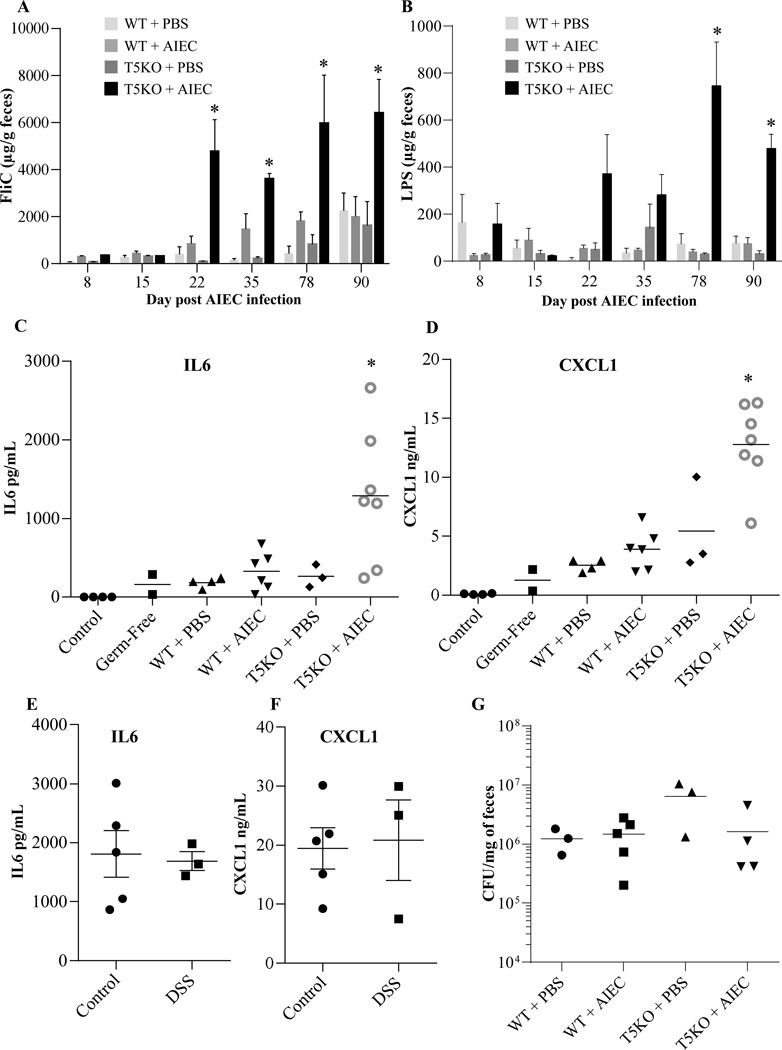
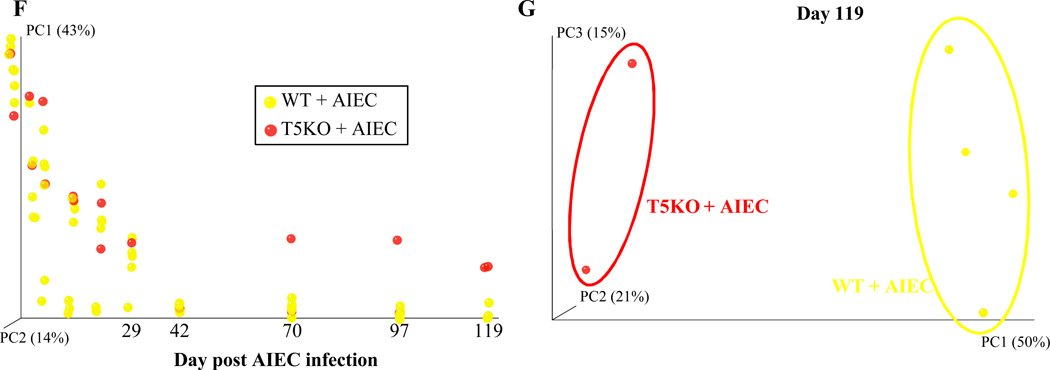
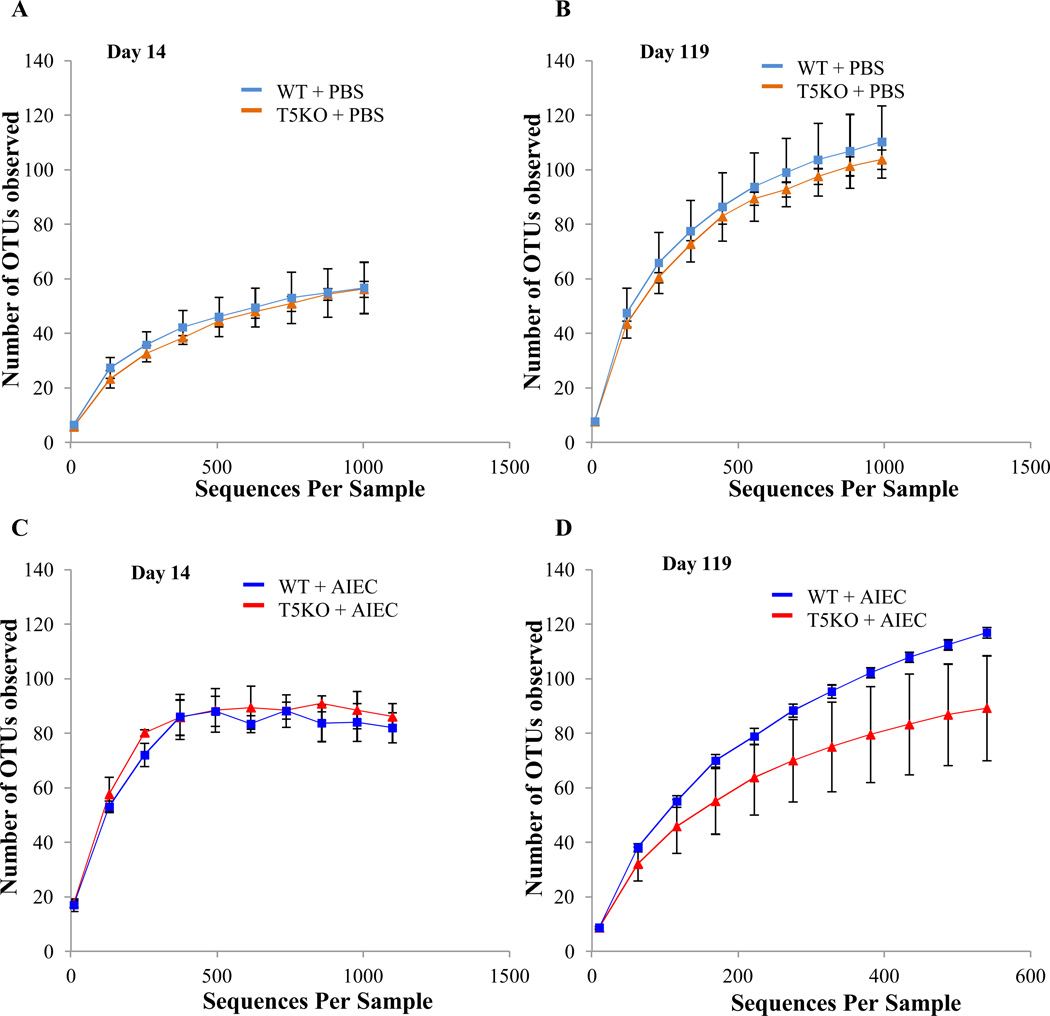
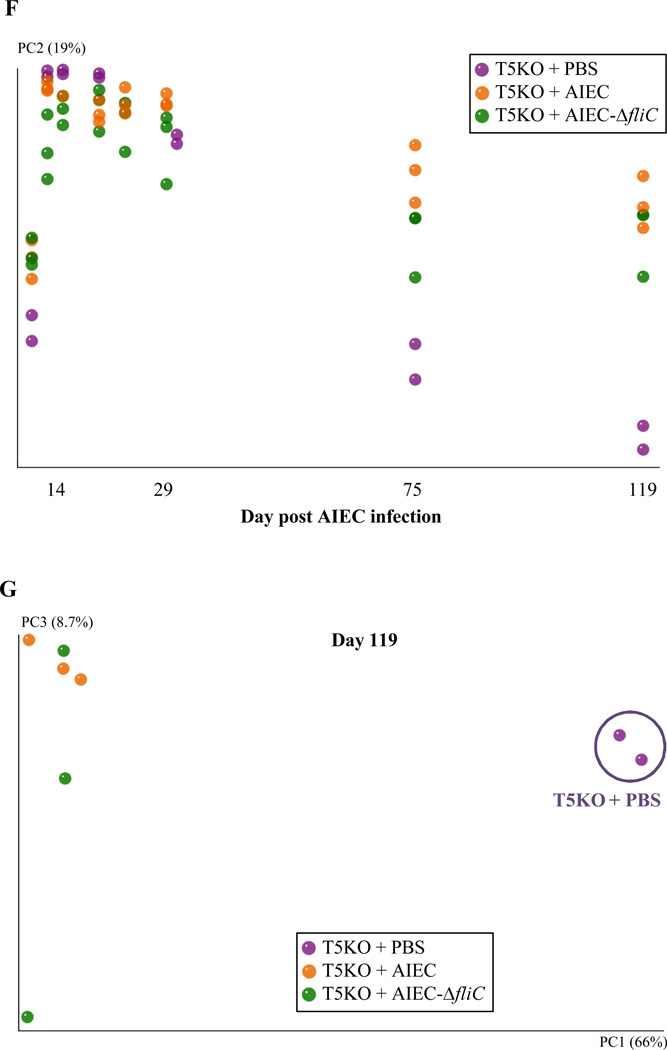
Results: Transient AIEC colonisation, in WT mice, did not alter inflammatory markers, bacterial loads, microbiota composition, nor its pro-inflammatory potential. By contrast, transient AIEC colonisation of T5KO mice drove chronic inflammation which correlated with microbiota components having higher levels of bioactive LPS and flagellin. Such AIEC-induced elevation of LPS and flagellin persisted well beyond AIEC clearance, required AIEC be flagellated, and was associated with alteration in microbiota species composition including a loss of species diversity.

Conclusions: AIEC, and perhaps other pathobionts, may instigate chronic inflammation in susceptible hosts by altering the gut microbiota composition so as to give it an inherently greater ability to activate innate immunity/pro-inflammatory gene expression.

Keywords: COLONIC MICROFLORA; CROHN'S DISEASE; INFLAMMATORY BOWEL DISEASE.


Figures

Figure 1
Figure 1. T5KO mice infected with AIEC strain LF82 developed intestinal inflammation associated with increased flagellin and LPS load
A. AIEC colonization was determined in WT and T5KO mice by platting on media containing selective antibiotics. Data are represented as means ± S.E.M. of N=5 mice per group. B. Fecal Lcn-2 levels were measured in feces by ELISA. Bars are means ± S.E.M. of N=5 mice per group. C–D. Fecal flagellin (C) and LPS (D) load were determined using HEK reporting cells. Bars are means ± S.E.M. of N=5 mice per group. E. Fecal bacterial load day 20 post infection, determined by q-PCR. Bar represent the means, N=3–4 mice per group.
Figure 2
Figure 2. Intestinal inflammation is dependent on AIEC infection and TLR5 deficiency. A–B
Fecal flagellin (A) and LPS (B) load were determined using HEK reporting cells. Bars are means ± S.E.M. of N=3/5 mice per group. C–F. Fecal suspension was injected intraperitoneally to RagKO mice, and IL6 (C, E) and CXCL1 (D, F) were measured in the serum 2h post injection. G. Fecal bacterial load day 90 post infection, determined by q-PCR. Bar represent the means, N=3/5 mice per group.
Figure 3
Figure 3. T5KO mice infected with AIEC displayed modified intestinal microbiota
A. AIEC colonization were determined in WT and T5KO mice based on 454 pyrosequencing 16S rRNA analysis to determine their relative abundance in feces. Data are represented as means ± S.E.M. of N=3/5 mice per group. B. Mouse fecal bacterial communities from WT uninfected (PBS) or infected with 107 AIEC strain LF82 were clustered using principal coordinates analysis (PCoA) of the unweighted UniFrac distance matrix. PC1 and PC2 are plotted for each time point (from day 1 to day 119). The time is expressed on the X axis, and the percentage of the variation explained by the plotted principal coordinates is indicated in the Y axis labels. C. Mouse fecal bacterial communities from WT uninfected (PBS) or infected with 107 AIEC strain LF82 were clustered using principal coordinates analysis (PCoA) of the UniFrac unweighted distance matrix. PC1, PC2, and PC3 are plotted and the percentage of the variation explained by the plotted principal coordinates is indicated in the Y axis labels. D. Mouse fecal bacterial communities from T5KO uninfected (PBS) or infected with 107 AIEC strain LF82 were clustered using principal coordinates analysis (PCoA) of the UniFrac unweighted distance matrix (see Figure 3B). E. Mouse fecal bacterial communities from T5KO uninfected (PBS) or infected with 107 AIEC strain LF82 were clustered using principal coordinates analysis (PCoA) of the UniFrac unweighted distance matrix (see Figure 3C). F. Mouse fecal bacterial communities from WT or T5KO mice infected with 107 AIEC strain LF82 were clustered using principal coordinates analysis (PCoA) of the UniFrac unweighted distance matrix (see Figure 3B). G. Mouse fecal bacterial communities from WT or T5KO mice infected with 107 AIEC strain LF82 were clustered using principal coordinates analysis (PCoA) of the UniFrac unweighted distance matrix (see Figure 3C). H. Members of the microbiota that differ in abundance between WT and T5KO mice infected with 107 AIEC strain LF82. The heat map indicates the relative abundance of the top 13 bacterial OTU accounting for the differences between WT and T5KO mice after AIEC infection. Columns show, for each sample, the abundance data of genera listed in the right part. The abundances of the genera were clustered using unsupervised hierarchical clustering (white, low abundance; red, high abundance). The phylum (P), class (C), order (O) and family (F) of each of the classifying OTUs is noted.
Figure 4
Figure 4. AIEC infection decrease the richness and diversity of intestinal microbiota in T5KO mice
Rarefaction curves at day 14 (A–C) and day 119 (B–D) for uninfected (A–B) or AIEC infected (C–D) groups. The rarefaction curve is based on 454-based DNA sequencing of 16S rRNA gene libraries from feces and depicts the number of unique operational taxonomic units (OTUs). Data are represented as mean ± S.E.M. of N=3/5 mice per group. The slope of the line is directly related to the number of unique OTUs (i.e. increased diversity) in a sample.
Figure 5
Figure 5. Microbiota modification after AIEC strain LF82 infection in T5KO susceptible mice seems independent of intestinal inflammation
A. AIEC colonization were determined in WT and T5KO mice based on 454 pyrosequencing 16S rRNA analysis to determine their relative abundance in stool. Data are represented as means ± S.E.M. of N=3 mice per group. B. Fecal Lcn-2 levels were measured in feces by ELISA. Bars are means ± S.E.M. of N=3 mice per group. C–D. Fecal flagellin (C) and LPS (D) load were determined using HEK reporting cells. Bars are means ± S.E.M. of N=3 mice per group. E. Fecal bacterial load, determined by q-PCR. Bar represent the means, N=2/3 mice per group. F. Mouse fecal bacterial communities from T5KO uninfected (PBS) or infected with 107 AIEC strain LF82 or LF82-ΔfliC isogenic mutant were clustered using principal coordinates analysis (PCoA) of the UniFrac unweighted distance matrix. PC1 and PC2 are plotted for each time point (from day 1 to day 119). The time is expressed on the X axis, and the percentage of the variation explained by the plotted principal coordinates is indicated in the Y axis labels. G. Mouse fecal bacterial communities from T5KO uninfected (PBS) or infected with 107 AIEC strain LF82 or LF82-ΔfliC isogenic mutant were clustered using principal coordinates analysis (PCoA) of the UniFrac unweighted distance matrix. PC1, PC2, and PC3 are plotted and the percentage of the variation explained by the plotted principal coordinates is indicated in the Y axis labels.

Comment in

References

    1. Kaser A, Zeissig S, Blumberg RS. Inflammatory bowel disease. Annu Rev Immunol. 2010;28:573–621. - PMC - PubMed
    1. Xavier RJ, Podolsky DK. Unravelling the pathogenesis of inflammatory bowel disease. Nature. 2007;448:427–434. - PubMed
    1. Chassaing B, Darfeuille-Michaud A. The commensal microbiota and enteropathogens in the pathogenesis of inflammatory bowel diseases. Gastroenterology. 2011;140:1720–1728. - PubMed
    1. DuPont AW, DuPont HL. The intestinal microbiota and chronic disorders of the gut. Nat Rev Gasto Hepathol. 2011;8:523–531. - PubMed
    1. Darfeuille-Michaud A, Boudeau J, Bulois P, Neut C, Glasser AL, Barnich N, et al. High prevalence of adherent-invasive Escherichia coli associated with ileal mucosa in Crohn's disease. Gastroenterology. 2004;127:412–421. - PubMed

Publication types

MeSH terms