. 2013 Oct;30(10):1367-75.
doi: 10.1007/s10815-013-0062-6. Epub 2013 Jul 30.

Embryo developmental capability and pregnancy outcome are related to the mitochondrial DNA copy number and ooplasmic volume

Affiliations

Embryo developmental capability and pregnancy outcome are related to the mitochondrial DNA copy number and ooplasmic volume

Yukitaka Murakoshi et al. J Assist Reprod Genet. 2013 Oct.

Abstract

Purpose: To investigate the correlation between the ooplasmic volume and the number of mitochondrial DNA (mtDNA) copies in embryos and how they may affect fecundity.

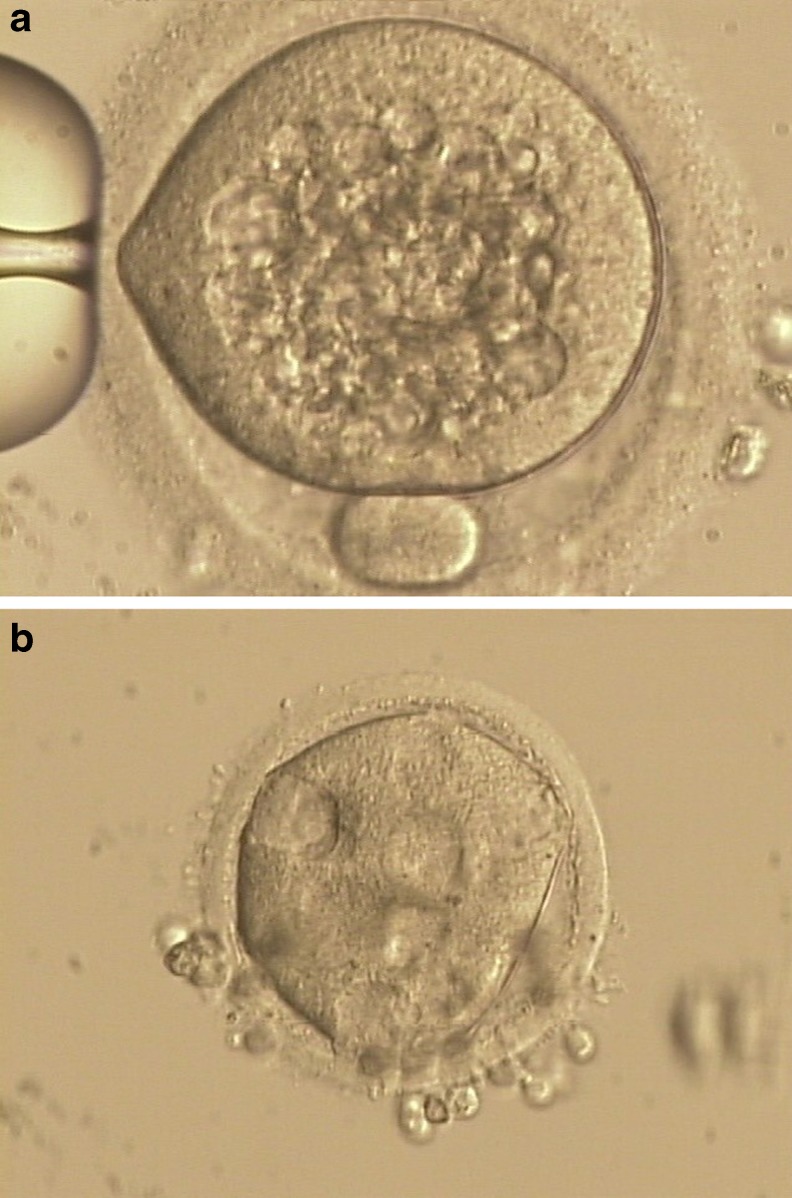
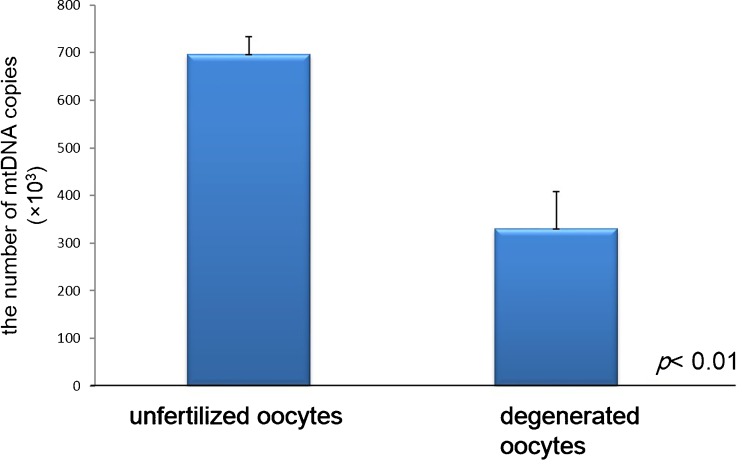
Method: Using real-time PCR, mtDNA quantification was analyzed in unfertilized oocytes and uncleaved embryos. The size of the ovum was also assessed by calculating the ooplasmic volume at the time of granulosa cell removal for IVF or ICSI. Quantification analysis of the mtDNA in blastomeres was performed by real-time PCR at the 7-8 cell stage of the cleaved embryos at 72 h after oocyte retrieval. We calculated the cytoplasmic volume of the blastomeres.

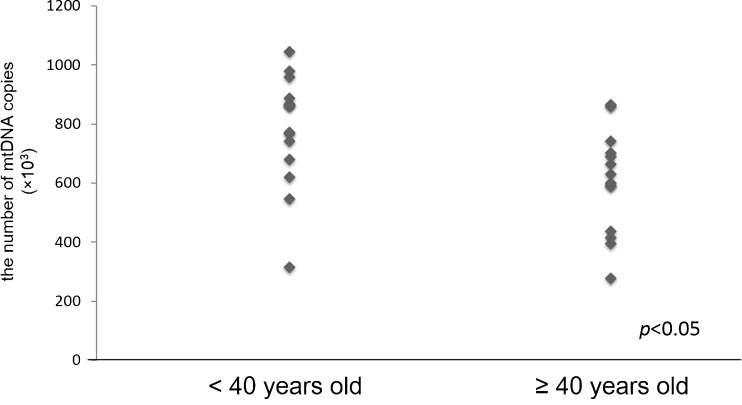
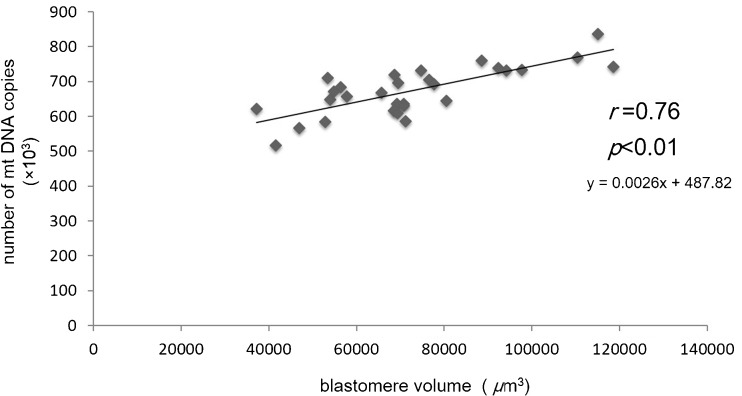
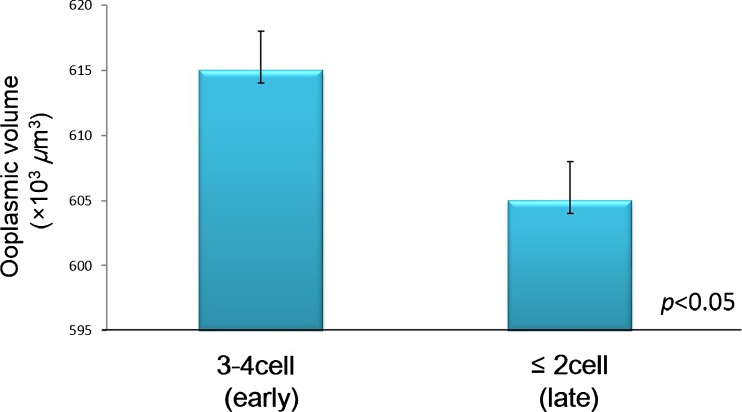
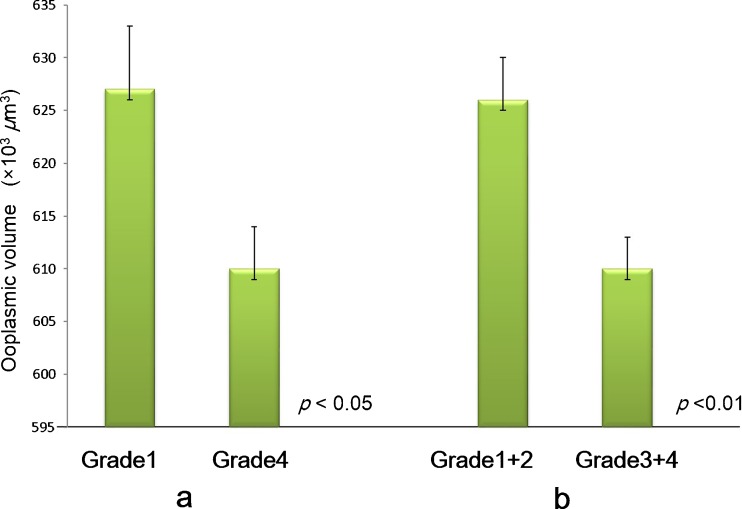
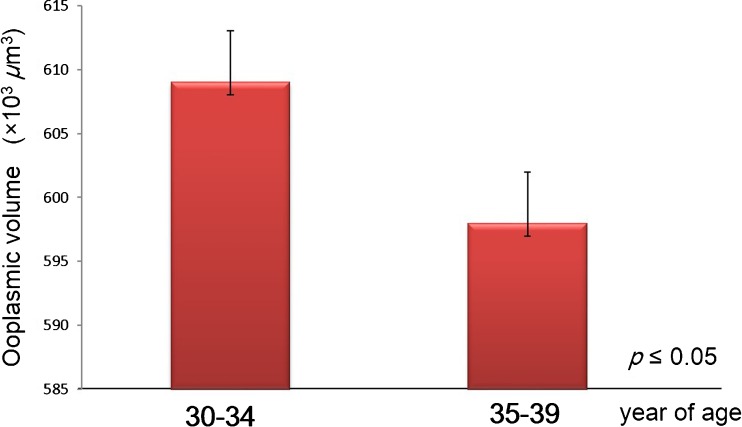
Result: Our studies showed a significantly lower mtDNA copy number in unfertilized oocytes and uncleaved embryos in women who were older than 40 years of age (p < 0.05). The larger ooplasmic volume was also associated with earlier and more rapid cleavage (p < 0.05). The ooplasmic volume was also significantly larger in the group achieving pregnancy. We found a significant positive correlation between blastomere volume and the number of mtDNA copies (r = 0.76, p < 0.01, from Pearson product-moment correlation coefficient).

Conclusions: We have shown that blastomere volume is directly proportional to the number of mtDNA copies. Therefore, larger cytoplasmic volume, with earlier cleavage speed, implies more mtDNA copies. Evaluation of mtDNA quantification and the measurement of ooplasmic and blastomere volume may be useful for selection of high quality embryo and pregnancy outcome.


Figures

Fig. 1
Fig. 1
a, b. Degenerated oocyte. Degenerated oocytes were characterized by multiple abnormal morphologic aspects, such as darkened, vacuolated, and irregular ooplasm [28, 29]. Differential interference contrast microscopy :objective (x400)
Fig. 2
Fig. 2
The number of mtDNA copies in unfertilized oocytes and uncleaved embryos. Quantification of mtDNA was performed by real-time PCR. We grouped subjects according to age <40 years old (from 31 to 39 years old, n = 15) and age ≥40 years old group (from 40 to 44 years old, n = 14); and we compared the numbers of mtDNA copies between the two groups. The average number of mtDNA copies was 784,307 ± 48,379 for age <40 years and 603,822 ± 46,153 for age ≥40 years. Our studies in unfertilized oocytes and uncleaved embryos in women who were older than 40 years of age showed significantly fewer mtDNA copies (p < 0.05)
Fig. 3
Fig. 3
The number of mtDNA copies in unfertilized oocytes and degenerate oocytes. Quantification of mtDNA was performed by real-time PCR. Our studies have shown that the average number of mtDNA copies in unfertilized oocytes and uncleaved embryos (from 31 to 44 years old, n = 29) was 697,176 ± 37,057. The average number of mtDNA copies for the nine degenerate oocytes (from 33 to 41 years old) was 330,513 ± 78,002. The number of mtDNA copies in degenerated oocytes showed a remarkable decrease in comparison with unfertilized oocytes and uncleaved embryos (p < 0.01)
Fig. 4
Fig. 4
Blastomere volume and the number of mtDNA copies at 72 h after oocyte retrieval. Four cleaved embryos at the 7–8 cell stage were collected for study at 72 h after oocyte retrieval (Veeck’s classification Grade1,3). Each single blastomeres (n = 29) were aspirated with a biopsy pipette. The diameter of each blastomere was measured under an inverted microscope. The long axis (D) and minor axis (d) of each blastomere were measured under an inverted microscope. We calculated the blastomere volume using (πd2D÷6, π = 3.14). Quantification of mtDNA was performed by real-time PCR. The average number of mtDNA copies in blastomeres was 673,722 ± 12,952. We found a significant positive correlation between blastomere volume and the number of mtDNA copies (r = 0.76, p < 0.01, from Pearson product–moment correlation coefficient)
Fig. 5
Fig. 5
Comparison of ooplasmic volume at oocyte retrieval and the speed of embryo cleavage at 44 h after oocyte retrieval. In embryonic development, 3–4 cell embryos showed a normal (early) cleavage speed. At 44 h after oocyte retrieval, 348 embryos had reached the 3–4 cell stage and the remaining 326 had not. The ooplasmic volume was compared between these groups. At 44 h after oocyte retrieval, the average ooplasmic volume of the 3–4 cell embryos was 615,222 ± 2,604 μm3 and that of those with fewer cells was 605,402 ± 3,145 μm3 (p < 0.05)
Fig. 6
Fig. 6
a Comparison of ooplasmic volume at oocyte retrieval and morphological classification of embryo developed at 44 h after oocyte retrieval:Grade1 vs Grade4. There was a total of 348 embryos at 44 h after oocyte retrieval which reached the normal (early) embryonic development stage. The Veeck’s classification and the average ooplasmic volume were as follows, respectively: Veeck 1 (n = 45), 626,774 ± 6,264 μm3; Veeck 2 (n = 64), 625,191 ± 5,844 μm3; Veeck 3 (n = 75), 611,083 ± 5,549 μm3; Veeck 4 (n = 164), 610,055 ± 3,938 μm3. When comparing Veeck 1 and Veeck 4, the ooplasmic volume was significantly different; the ooplasmic volume of Veeck1 was significantly larger than that of Veeck 4 (p < 0.05). b Comparison of ooplasmic volume at oocyte retrieval and morphological classification of embryo developed at 44 h after oocyte retrieval: Grade1 + 2 vs Grade3 + 4. The comparison between Veeck 1 + 2 (n = 109), and Veeck 3 + 4 (n = 239) also showed a significant difference in the ooplasmic volume; the ooplasmic volume of Veeck 1 + 2 (625,845 ± 4,278 μm3) was significantly larger than that of Veeck 3 + 4 (610,377 ± 3,208 μm3) (p < 0.01)
Fig. 7
Fig. 7
Ooplasmic volume at oocyte retrieval between two different age groups: 30–34 vs 35–39. We analyzed the association between age and ooplasmic volume. The 35–39 year age group (n = 209, volume 597,634 ± 3,731 μm3) showed significantly lower ooplasmic volume when compared to the 30–34 year age group (n = 146, volume 608,572 ± 3,997 μm3) (p ≤ 0.05)

Similar articles

Cited by

References

    1. Hill GA, Freeman M, Bastias MC, Rogers BJ, Herbert CM, 3rd, Osteen KG, Wentz AC. The influence of oocyte maturity and embryo quality on pregnancy rate in a program for in vitro fertilization–embryo transfer. Fertil Steril. 1989;52(5):801–806. - PubMed
    1. Shulman A, Ben Nun I, Ghetler Y, Kaneti H, Shilon M, Beyth Y. Relationship between embryo morphology and implantation rate after in vitro fertilization treatment in conception cycles. Fertil Steril. 1993;60(1):123–126. - PubMed
    1. Cohen J, Inge KL, Suzman M, Wiker SR, Wright G. Videocinematography of fresh and cryopreserved embryos: a retrospective analysis of embryonic morphology and implantation. Fertil Steril. 1989;51(5):820–827. - PubMed
    1. Pelinck MJ, De Vos M, Dekens M, Van der Elst J, De Sutter P, Dhont M. Embryos cultured in vitro with multinucleated blastomeres have poor implantation potential in human in vitro fertilization and intracytoplasmic sperm injection. Hum Reprod. 1998;13(4):960–963. doi: 10.1093/humrep/13.4.960. - DOI - PubMed
    1. Wilding M, Di Matteo L, D’Andretti S, Montanaro N, Capobianco C, Dale B. An oocyte score for use in assisted reproduction. J Assist Reprod Genet. 2007;24(8):350–358. doi: 10.1007/s10815-007-9143-8. - DOI - PMC - PubMed

Publication types

Substances

LinkOut - more resources