. 2013 Nov;43(11):3061-75.
doi: 10.1002/eji.201343416. Epub 2013 Aug 27.

Noncoordinate expression of J-chain and Blimp-1 define nurse shark plasma cell populations during ontogeny

Affiliations

Noncoordinate expression of J-chain and Blimp-1 define nurse shark plasma cell populations during ontogeny

Caitlin D Castro et al. Eur J Immunol. 2013 Nov.

Abstract

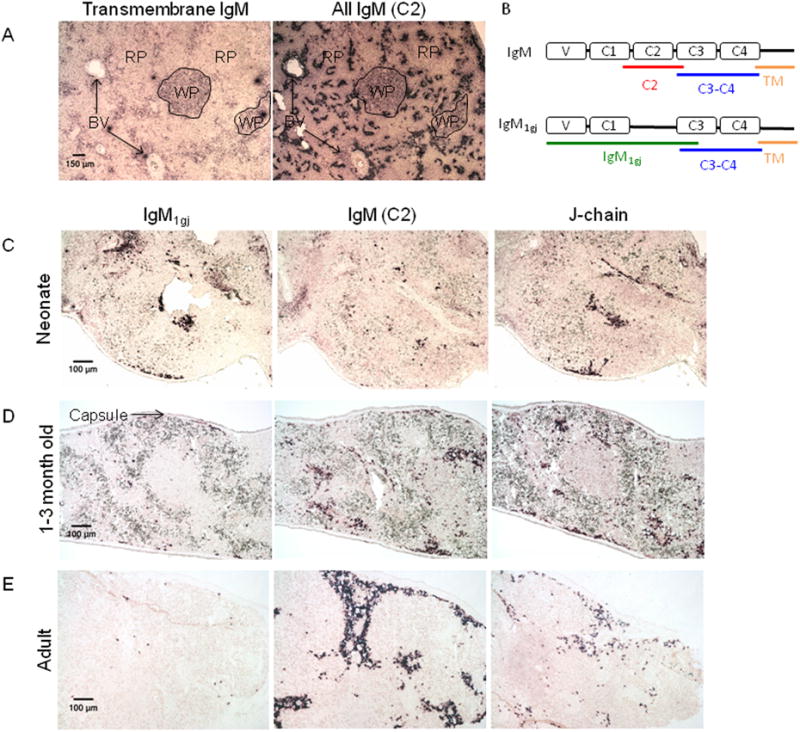
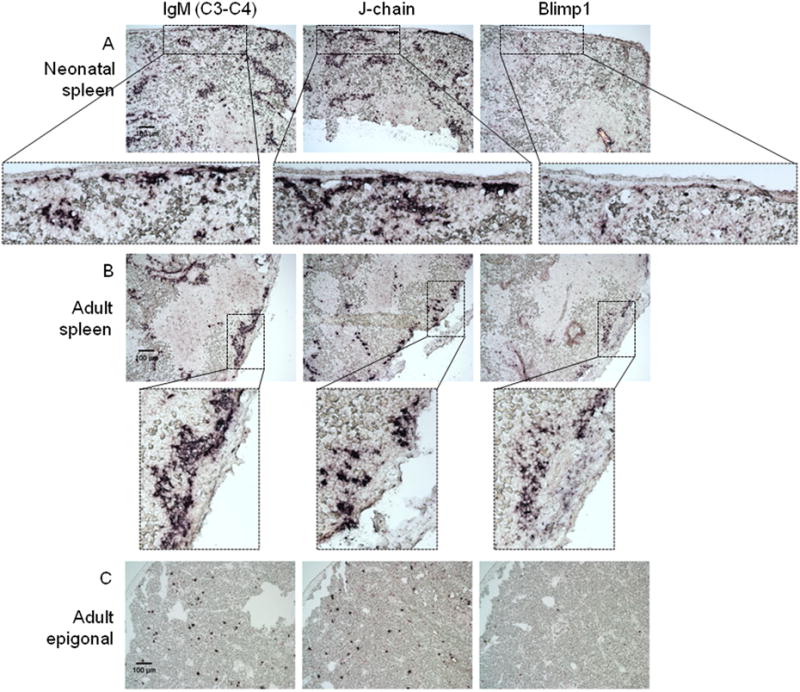
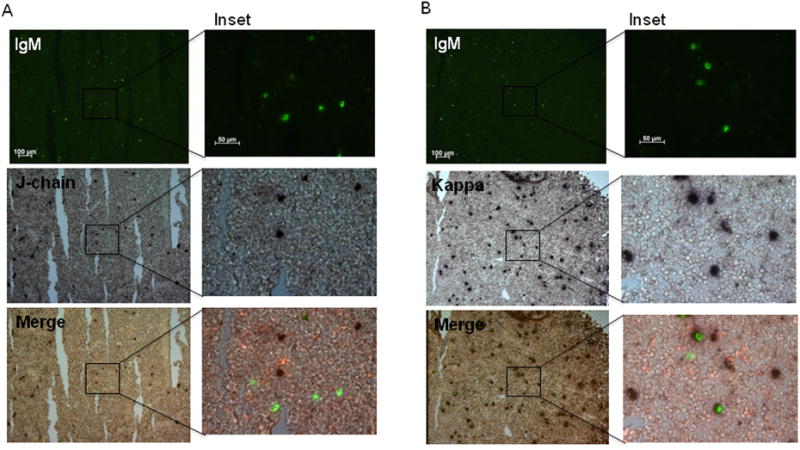
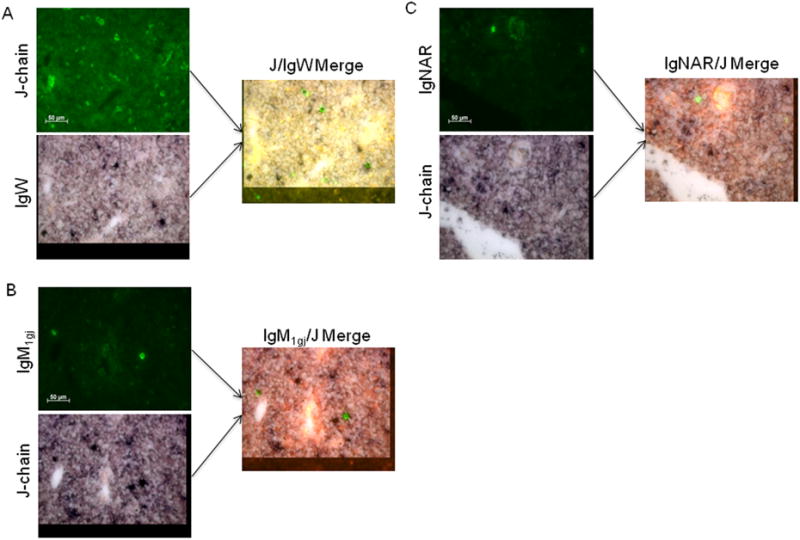
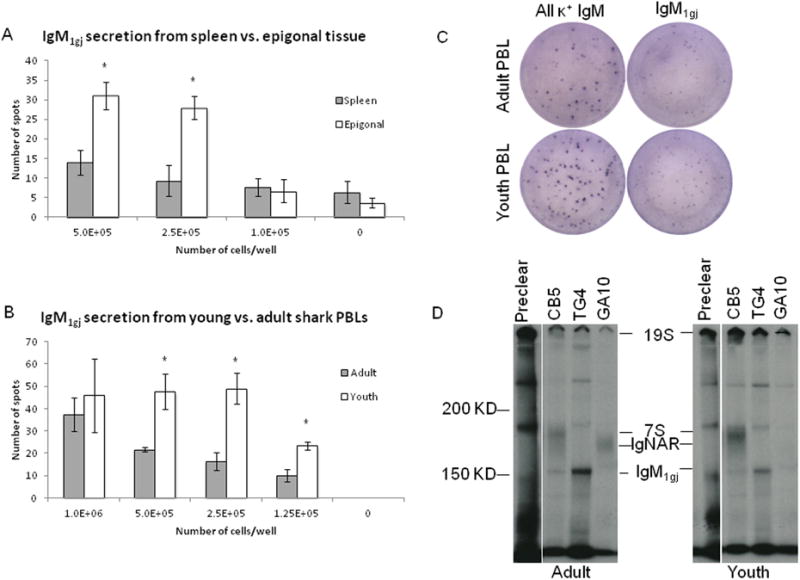
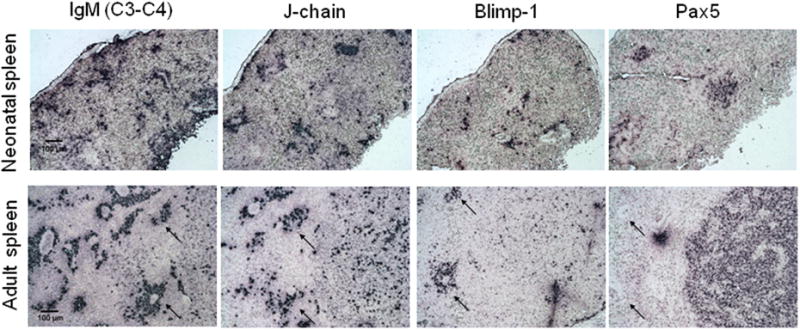
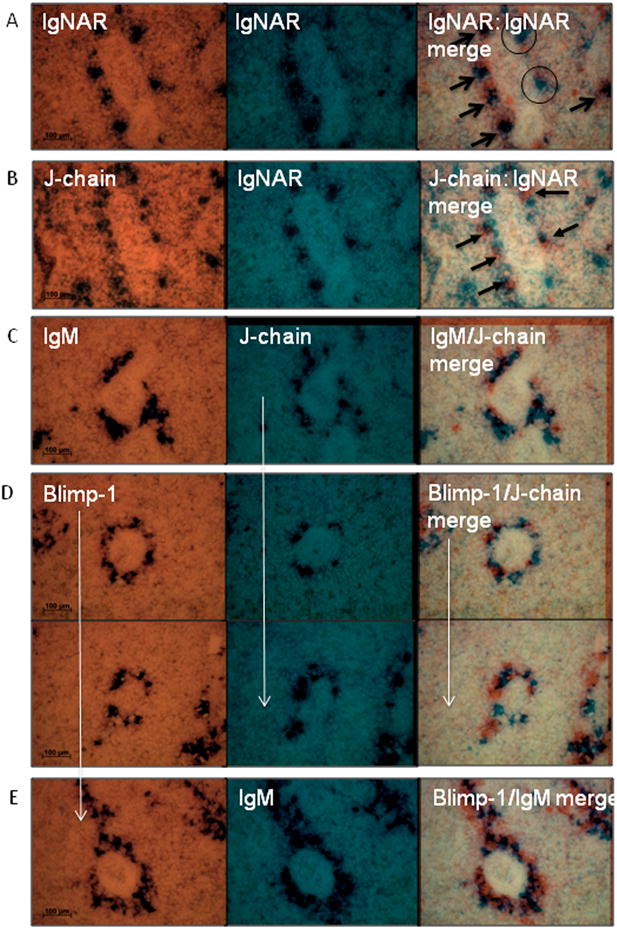
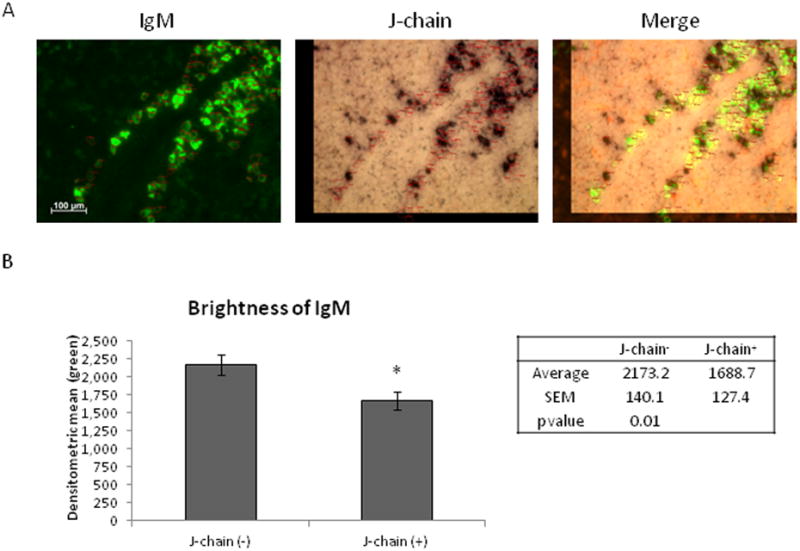
B-lymphocyte-induced maturation protein 1 (Blimp-1) is the master regulator of plasma cell development, controlling genes such as those encoding J-chain and secretory Ig heavy chain. However, some mammalian plasma cells do not express J-chain, and mammalian B1 cells secrete "natural" IgM antibodies without upregulating Blimp-1. While these results have been controversial in mammalian systems, here we describe subsets of normally occurring Blimp-1(-) antibody-secreting cells in nurse sharks, found in lymphoid tissues at all ontogenic stages. Sharks naturally produce large amounts of both pentameric (classically "19S") and monomeric (classically "7S") IgM, the latter an indicator of adaptive immunity. Consistent with the mammalian paradigm, shark Blimp-1 is expressed in splenic 7S IgM-secreting cells, though rarely detected in the J-chain(+) cells producing 19S IgM. Although IgM transcript levels are lower in J-chain(+) cells, these cells nevertheless secrete 19S IgM in the absence of Blimp-1, as demonstrated by ELISPOT and metabolic labeling. Additionally, cells in the shark BM equivalent (epigonal) are Blimp-1(-). Our data suggest that, in sharks, 19S-secreting cells and other secreting memory B cells in the epigonal are maintained for long periods without Blimp-1, but like in mammals, Blimp-1 is required for terminating the B-cell program following an adaptive immune response in the spleen.

Keywords: B cells; Evolution; Immunoglobulins; Lymphoid organs; Transcription factors.


Figures

Figure 1
Figure 1. Expression of immunoglobulin genes in nurse shark spleen tissue throughout development
(A) In situ hybridization of 8μm (non consecutive) sections of spleen tissue from an adult shark (shark W), stained with riboprobes specific for IgM-TM (left) or the C2 domain of IgM (right). Regions of white pulp B cell zones (WP), red pulp (RP) and blood vessels (BV) are marked. Each photo was taken at 4× magnification, and shown with 150 μm scale bar. (B) Schematic mockup of domain structure of IgM and IgM1gj with approximate probe position marked. A red line indicates the position of conventional IgM-specific C2-domain-specific probe, blue line is a C3-C4 domain-specific probe that detects both IgM and IgM1gj, the green line is an IgMigj specific probe and the orange line indicates the location of a TM probe. (C-E) In situ hybridization of 8μm (non consecutive) sections of spleen tissue from three sharks ages: 5 days (shark TH) (C), 1-2 months (shark LA) (D), and adult (shark LJ) (E). Probes are specific for: IgM1gj (left), C2-domain of conventional IgM (middle), and J-chain (right). All photos were taken at 10× magnification and one image from each tissue shown with 100 μm scale bar. Each shark is representative of at least one other shark of that age (data not shown). Positive staining is purple. Negative controls with sense probes showed no staining (not shown).
Figure 2
Figure 2. Expression of IgM, J-chain and Blimp-1 in adult nurse shark spleen and epigonal tissue
In situ hybridization of 8μm (non consecutive) sections from spleen (A and B) or epigonal (C) tissue from neonatal (shark LA) (A) or adult (shark EL) (B and C) nurse sharks. Probes are specific for: IgM C3-C4 (left), which recognizes both IgM1gj and rearranging IgM, J-chain (middle) or Blimp-1 (right). Images taken at 10× magnification with 100 μm scale bar indicated in C3-C4 stain. Dotted boxes represent insets of 3× digital zoom from each 10× image. Positive staining is purple. Negative controls with sense probes showed no staining (not shown). Data are representative of at least 2 experiments for each stain set and age.
Figure 3
Figure 3. Co-expression of IgM with either J-chain or IgLκ in epigonal tissue
In situ hybridization of 8μm sections of epigonal tissue from an adult shark (shark W), double-stained with either IgM-DIG and J-chain-FLU (A) or IgM-DIG and Kappa light chain-FLU probes (B).IgM-positive cells (top) are green, and positive staining for J-chain (A) or IgLκ (B) staining (middle) is purple. Images are merged at bottom. Images on the left were taken at 10× magnification with 100 μm scale bar shown in IgM stain, and insets on the right are at 40× magnification with 50 μm scale bars. Black boxes denote the regions of magnified insets. Negative controls with sense probes showed no staining (not shown). Data are representative of at least 2 experiments for each stain set and age.
Figure 4
Figure 4. Co-expression of J-chain and non-IgM isotypes in epigonal tissue
In situ hybridization of 8 μm sections of epigonal tissue from an adult shark (shark W), double stained with J-chain-DIG and IgW-FLU (A), IgNAR-DIG and J-chain-FLU (B), or IgM1gj-DIG and J-chain-FLU (C) probes. Cells positive for DIG-labeled probes (left) stain green. Cells positive for FLU-labeled probes (middle) stain purple. Images are merged at right. All photographs were taken at 40× magnification with 50 μm scale bar marked. Negative controls with sense probes showed no staining (not shown).
Figure 5
Figure 5. IgM1gj protein secretion
Number of positive ELSPOTS using cells from spleen (grey bars) or epigonal (white bars) tissue from a 1 year old shark (shark EN), where secreted Ig was captured with anti-IgM1gj mAb, TG4 and detected with biotinylated mAb, GA16 (A). IgM1gj secretion from PBLs was also measured by ELISPOT using blood from an adult (shark B, grey bars) or young (shark R, white bars) shark, LK14 capture, and biotinylated TG4 detection (B). Each data point represents triplicate cell platings for that condition and (*) indicates p-value of less than 0.05 (T-test). Error bars signify SEM. Representative ELISPOT wells of secreted IgM1gjfrom (B) or from CB5-coated, LK14-biotin detected Ig are shown in (C). Immunoprecipitations were performed on radiolabeled supernatants from the same cells used in (B) and (C). Samples from protein G preclears or immunoprecipitations with CB5 (anti-IgM), TG4 (anti-IgM1gj) or GA10 (anti-NAR) were run non-reduced on 5% gels and film was exposed for 1 week (D) [21].
Figure 6
Figure 6. Pax5 expression in young and adult spleen tissue
In situ hybridization staining of 8μm (non consecutive) sections of spleen tissue from a 1 month old (shark H) (A) or adult shark (shark W) (B). From left to right probes are specific for: IgM spanning C3-C4, J-chain, Blimp- or Pax5. Black arrows indicate regions near blood vessels where plasma cells congregate. All photographs taken at 10× magnification with 100 μm scale bar shown. Positive staining is purple. Negative controls with sense probes showed no staining (not shown).
Figure 7
Figure 7. In situ hybridization for co-expression using consecutive spleen tissue sections
In situ hybridization of consecutive 6 μm sections of sections of adult spleen tissue (shark W). Consecutive sections were stained with the probes indicated and the two images pseudocolored and field stitched together (right column). Probe pairs were IgNAR:IgNAR (A), J-chain:IgNAR (B), IgM:J-chain (C), Blimp-1:J-chain (D) and Blimp-1:IgM (E).Vertical white arrows indicate same probe used as photo above. Presence of black stain in the merge (far right) column indicates coexpression. Arrows in (A) indicate cells expressing IgNAR in both fields. Circles in (A) indicate IgNAR+ cells only seen in one of the two fields. Arrows in (B) indicate IgNAR+/J-chain- cells (orange in merge). All images were taken at 40× magnification and 100 μm scale bar is indicated in left-hand column. Each region is representative of multiple stains.
Figure 8
Figure 8. Variable strength of IgM signal in J-chain positive and negative spleen cells
In situ hybridization double stain of 6 μm sections spleen tissue from an adult shark (shark W). (A) Slides were double stained with IgM-C3-C4-DIG (left) and J-chain-FLU (middle) riboprobes. Images merged at right. Photographs taken at 40× magnification and marked with a 100 μm scale bar. (B) Data from 50 cells each of J-chain+ and J-chain- cells (from multiple fields of view) were pooled to get an average mean fluorescent intensity of the IgM stain (green). (*) indicates p-value of less than 0.05 (T-test). Error bars signify SEM.

Similar articles

Cited by

References

    1. Coutinho A, Kazatchkine MD, Avrameas S. Natural autoantibodies. Curr Opin Immunol. 1995;7:812–818. - PubMed
    1. Alugupalli KR, Leong JM, Woodland RT, Muramatsu M, Honjo T, Gerstein RM. B1b lymphocytes confer T cell-independent long-lasting immunity. Immunity. 2004;21:379–390. doi: 10.1016/j.immuni.2004.06.019. - DOI - PubMed
    1. Thurnheer MC, Zuercher AW, Cebra JJ, Bos NA. B1 cells contribute to serum IgM, but not to intestinal IgA, production in gnotobiotic ig allotype chimeric mice. J Immunol. 2003;170:4564–4571. - PubMed
    1. Baumgarth N, Tung JW, Herzenberg LA. Inherent specificities in natural antibodies: A key to immune defense against pathogen invasion. Springer Semin Immunopathol. 2005;26:347–362. doi: 10.1007/s00281-004-0182-2. - DOI - PubMed
    1. Hardy RR. B-1 B cell development. J Immunol. 2006;177:2749–2754. - PubMed

Publication types

MeSH terms

LinkOut - more resources