. 2014 Apr;38(4):619-24.
doi: 10.1038/ijo.2013.139. Epub 2013 Jul 30.

Sleep fragmentation promotes NADPH oxidase 2-mediated adipose tissue inflammation leading to insulin resistance in mice

Affiliations

Sleep fragmentation promotes NADPH oxidase 2-mediated adipose tissue inflammation leading to insulin resistance in mice

S X L Zhang et al. Int J Obes (Lond). 2014 Apr.

Abstract

Background: Short sleep has been implicated in higher risk of obesity in humans, and is associated with insulin resistance. However, the effects of fragmented sleep (SF) rather than curtailed sleep on glucose homeostasis are unknown.

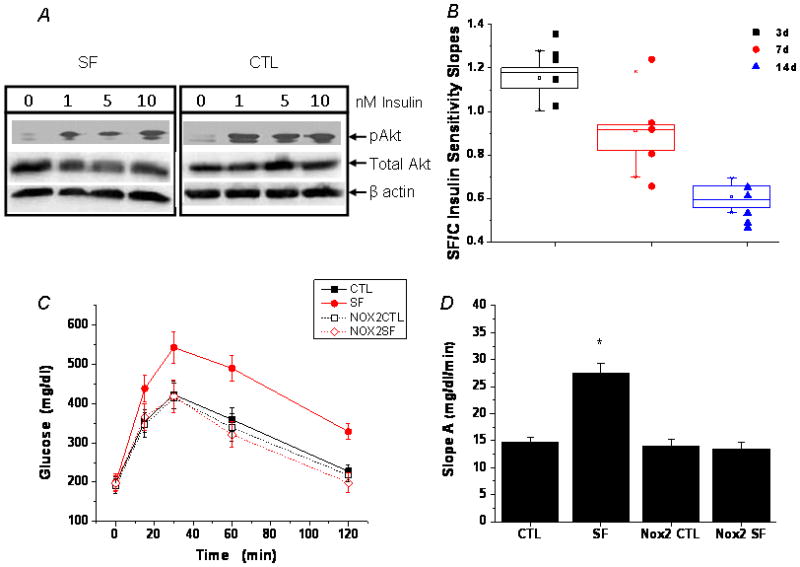
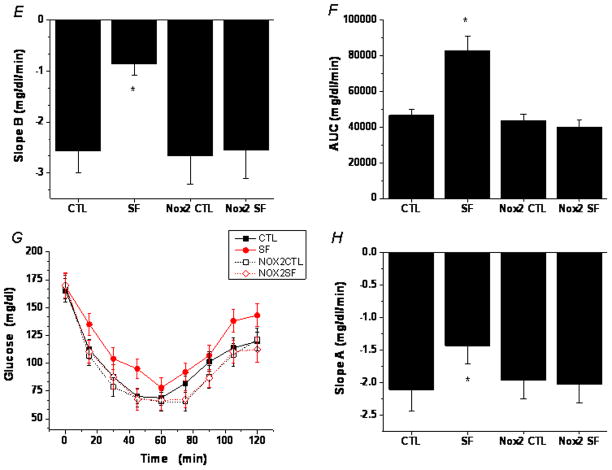
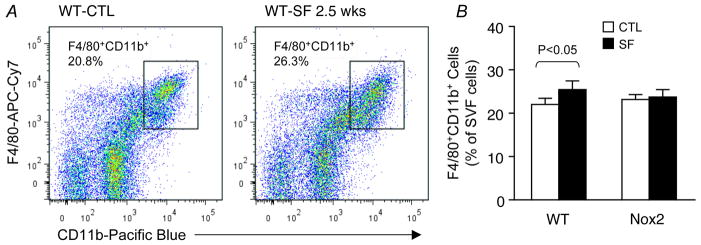
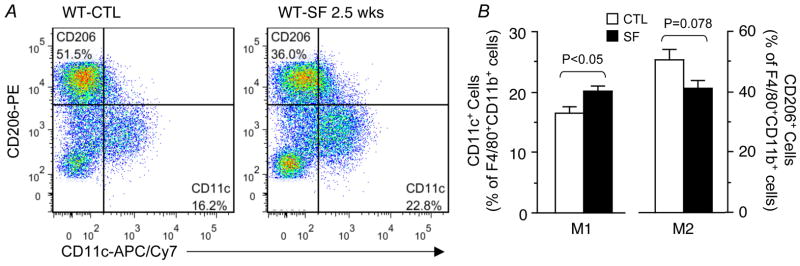
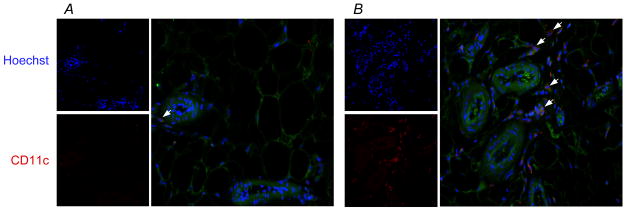
Methods: Wild-type and NADPH oxidase 2 (Nox2) null male mice were subjected to SF or sleep control conditions for 3 days to 3 weeks. Systemic and visceral adipose tissue (VAT) insulin sensitivity tests, glucose tolerance test, fluorescence-activated cell sorting and immunohistochemistry for macrophages and its sub-types (M1 and M2), and Nox expression and activity were examined.

Results: Here we show that SF in the absence of sleep curtailment induces time-dependent insulin resistance, in vivo and also in vitro in VAT. Oxidative stress pathways were upregulated by SF in VAT, and were accompanied by M1 macrophage polarization. SF-induced oxidative stress, inflammation and insulin resistance in VAT were completely abrogated in genetically altered mice lacking Nox2 activity.

Conclusions: These studies imply that SF, a frequent occurrence in many disorders and more specifically in sleep apnea, is a potent inducer of insulin resistance via activation of oxidative stress and inflammatory pathways, thereby opening the way for therapeutic strategies.


Conflict of interest statement

Conflict of Interest: The authors have no conflict of interest to declare in relation to this manuscript.

Figures

Figure 1
Figure 1. SF-induced insulin resistance in wild-type, but not Nox2-deficient mice
A. Adipocyte insulin sensitivity in WT mice assessed by insulin-induced Akt phosphorylation in adipocytes isolated from epididymal fat pads. Shown are representative Western blots. B. Boxplots of SF-induced temporal alterations in in vitro adipocyte insulin sensitivity in WT mice, cxalculated as the SF vs. control ratio of insulin dose-response slopes. N=5 for each group. Slopes of mice exposed to SF for 3 days were significantly increased (p<0.01) compared to timed controls. After 7 days of SF no significant changes emerged (p>0.1), while after 14 days a dramatic decrease (p<0.00003) in insulin sensitivity became apparent. C. SF-induced glucose intolerance as shown by GTT. Data are mean ± SE; n=6 for each experimental group. D. SF-induced glucose intolerance in WT, but not Nox2-deficient mice as shown by a steeper slope A calculated using the glucose levels between 0–15 min after glucose injection. Data are mean ± SE; n=6 for each group; *P< 0.05 vs. all other three groups. E. SF-induced reduced glucose clearance in WT, but not Nox2-deficient mice as shown by a flatter slope B calculated using glucose levels between the peak (30 min) and 120 min after glucose injection. Data are mean ± SE; n=6 for each group; *P< 0.05 vs. all other three groups. F. SF-induced glucose intolerance in WT, but not Nox2-deficient mice as shown by a greater area under the curve (AUC) after glucose injection. Data are mean ± SE; n=6 for each group; *P< 0.05 vs all other three groups. G. SF-induced insulin insensitivity as shown by ITT. Data are mean ± SE; n=6 for each group. H. SF-induced insulin insensitivity in WT, but not Nox2-deficient mice as shown by a flatter slope A calculated using the glucose levels between 0 min and the nadir (60 min) after insulin injection. Data are mean ± SE; n=6 for each group; *P< 0.05 vs. all other three groups.
Figure 2
Figure 2. SF-induced increases in global macrophage numbers in visceral fat of wild-type, but not Nox2-deficient mice
A. A representative flow cytometry analysis showing a moderate increase in the number of F4/80+CD11b+ macrophages in visceral fat of a WT mouse exposed to SF for 2.5 weeks. This phenomenon was absent in Nox2-deficient gp91phox-/Y mice. B. Summary of 4 independent flow cytometry experiments. Data are mean ± SE; n=4 for each group.
Figure 3
Figure 3. SF-induced selective increase in the number of pro-inflammatory M1 macrophages in visceral fat of wild-type, but not Nox2-deficient mice
A. A representative flow cytometry analysis showing an increase in the number of CD11c+ M1 macrophages in visceral fat of a WT mouse exposed to SF for 2.5 weeks. Such SF-induced effect on the pro-inflammatory M1 subset was not observed in Nox2-deficient gp91phox-/Y mice. B. Summary of 5 independent flow cytometry experiments. Notice that SF-induced decrease in the M2 subset was not significant at this stage of chronic SF. Data are mean ± SE; n=5 for each group.
Figure 4
Figure 4. SF induces pro-inflammatory M1 macrophage infiltration in visceral fat
A. Visceral fat from a WT control mouse immunostained with the M1 marker CD11c. Nuclei were co-stained with the Hoechst dye. Sporadic CD11c+ M1 cells are shown in perivascular areas. B. Visceral fat from a WT mouse exposed to SF for 3 weeks, showing clusters of CD11c+ M1 cells in perivascular areas.
Figure 5
Figure 5. SF-induced increases in Nox subunit expression and enzymatic activity in visceral adipose tissue
A. SF increased p47phox mRNA expression in visceral fat from WT mice. Data are mean ± SD; n=6 for each group. * P<0.05 vs. the control group. B. SVF cells isolated from WT, but not Nox2-deficient gp91phox-/Y mice exposed to SF for 3–4 weeks possessed elevated Nox enzymatic activity. Shown are representative kinetic tracings. C. Summary of 6 enzymatic activity experiments. Data are mean ± SE; n=6 for each group.

Similar articles

Cited by

References

    1. Spiegel K, Leproult R, Van Cauter E. Impact of sleep debt on metabolic and endocrine function. Lancet. 1999;354:1435–9. - PubMed
    1. Tasali E, Leproult R, Ehrmann DA, Van Cauter E. Slow-wave sleep and the risk of type 2 diabetes in humans. Proc Natl Acad Sci U S A. 2008;105:1044–9. - PMC - PubMed
    1. Morselli L, Leproult R, Balbo M, Spiegel K. Role of sleep duration in the regulation of glucose metabolism and appetite. Best Pract Res Clin Endocrinol Metab. 2010;24:687–702. - PMC - PubMed
    1. Buxton OM, Pavlova M, Reid EW, Wang W, Simonson DC, Adler GK. Sleep restriction for 1 week reduces insulin sensitivity in healthy men. Diabetes. 2010;59:2126–33. - PMC - PubMed
    1. Pejovic S, Vgontzas AN, Basta M, Tsaoussoglou M, Zoumakis E, Vgontzas A, et al. Leptin and hunger levels in young healthy adults after one night of sleep loss. J Sleep Res. 2010;19:552–8. - PMC - PubMed

Publication types