. 2013 Sep 1;591(17):4301-19.
doi: 10.1113/jphysiol.2013.253583. Epub 2013 Jul 29.

Evoked centripetal Ca(2+) mobilization in cardiac Purkinje cells: insight from a model of three Ca(2+) release regions

Affiliations

Evoked centripetal Ca(2+) mobilization in cardiac Purkinje cells: insight from a model of three Ca(2+) release regions

Kazi T Haq et al. J Physiol. .

Abstract

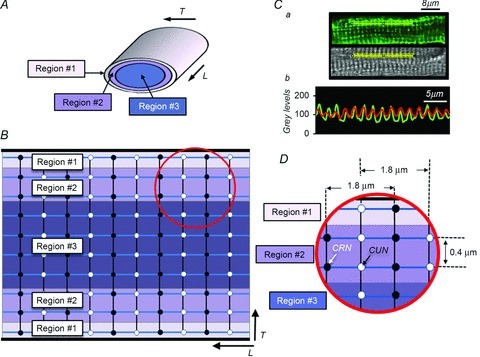
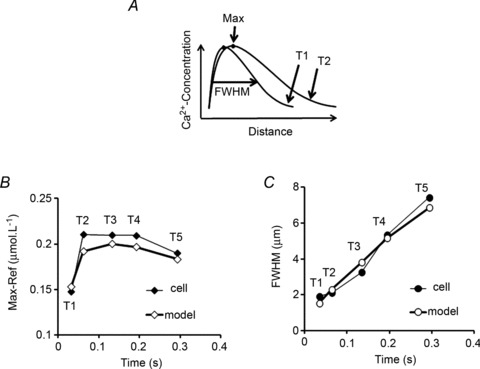
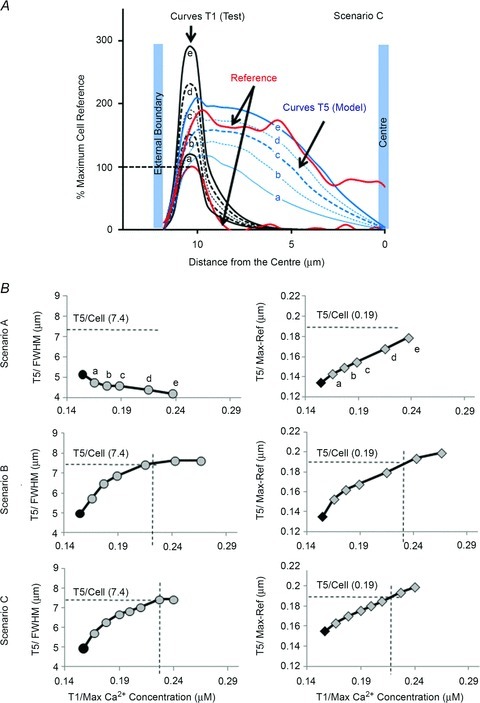
Despite strong suspicion that abnormal Ca(2+) handling in Purkinje cells (P-cells) is implicated in life-threatening forms of ventricular tachycardias, the mechanism underlying the Ca(2+) cycling of these cells under normal conditions is still unclear. There is mounting evidence that P-cells have a unique Ca(2+) handling system. Notably complex spontaneous Ca(2+) activity was previously recorded in canine P-cells and was explained by a mechanistic hypothesis involving a triple layered system of Ca(2+) release channels. Here we examined the validity of this hypothesis for the electrically evoked Ca(2+) transient which was shown, in the dog and rabbit, to occur progressively from the periphery to the interior of the cell. To do so, the hypothesis was incorporated in a model of intracellular Ca(2+) dynamics which was then used to reproduce numerically the Ca(2+) activity of P-cells under stimulated conditions. The modelling was thus performed through a 2D computational array that encompassed three distinct Ca(2+) release nodes arranged, respectively, into three consecutive adjacent regions. A system of partial differential equations (PDEs) expressed numerically the principal cellular functions that modulate the local cytosolic Ca(2+) concentration (Cai). The apparent node-to-node progression of elevated Cai was obtained by combining Ca(2+) diffusion and 'Ca(2+)-induced Ca(2+) release'. To provide the modelling with a reliable experimental reference, we first re-examined the Ca(2+) mobilization in swine stimulated P-cells by 2D confocal microscopy. As reported earlier for the dog and rabbit, a centripetal Ca(2+) transient was readily visible in 22 stimulated P-cells from six adult Yucatan swine hearts (pacing rate: 0.1 Hz; pulse duration: 25 ms, pulse amplitude: 10% above threshold; 1 mm Ca(2+); 35°C; pH 7.3). An accurate replication of the observed centripetal Ca(2+) propagation was generated by the model for four representative cell examples and confirmed by statistical comparisons of simulations against cell data. Selective inactivation of Ca(2+) release regions of the computational array showed that an intermediate layer of Ca(2+) release nodes with an ~30-40% lower Ca(2+) activation threshold was required to reproduce the phenomenon. Our computational analysis was therefore fully consistent with the activation of a triple layered system of Ca(2+) release channels as a mechanism of centripetal Ca(2+) signalling in P-cells. Moreover, the model clearly indicated that the intermediate Ca(2+) release layer with increased sensitivity for Ca(2+) plays an important role in the specific intracellular Ca(2+) mobilization of Purkinje fibres and could therefore be a relevant determinant of cardiac conduction.


Figures

Figure 1
Figure 1. Spatial domain of the computational Purkinje cell model
A, the P-cell model is of cylindrical shape. B, a segment of cell is modelled in two dimensions as an array of nodes. The array includes two types of node: Ca2+ release nodes (CRNs) and Ca2+ uptake nodes (CUNs). Transverse (T) spacing between CRNs is 0.4 μm (Chen-Izu et al. 2006). Longitudinal (L) spacing between CRNs (1.8 μm) was determined directly from ryanodine receptors (RyRs) distribution in freshly isolated porcine P-cells as indicated in C. Longitudinal RyRs distribution and sarcomere striation of myofibrils were assessed on the same cell in confocal and bright field illumination modes, respectively, as indicated in C. Spacing between peaks of fluorescence intensity was measured by frequency analysis along average pixel lines (see yellow lines in a) as shown in panel b. Comparison between RyR antibody distribution (panel b; green curve) and sarcomere striation (panel b; red curve) indicated that RyR antibody (see peaks of green curve) was localized at the centre of I-bands (see peaks of red curve). The basic computational array included three distinct forms of CRN, which were arranged, respectively, in three different regions as indicated in A, B and D (see text for details). Note that measurements reported in C have been reproduced on 6 different cells (results not shown here).
Figure 2
Figure 2. Typical centripetal Ca2+ mobilization in stimulated porcine Purkinje cells
Freshly isolated Purkinje cells were incubated with Fluo-4AM and electrically paced at 0.1 Hz in the presence of 1 mm Ca2+. A, images a–h were selected from a set of 600 video frames (30 frames s-1) of two representative porcine P-cells. Elevated fluorescence signal propagated from the cell periphery to the centre upon stimulation (frames a–e). The signal then decreased uniformly throughout the cytosol (frames f, g, h). Cell segments were selected as indicated in frame b; F/Fo ratio images processed from frames a–e exhibited the same evoked centripetal propagation, hence ruling out non-uniform Fluo-4 distribution. B, time course of transverse Cai variation in a stimulated porcine P-cell. Fluorescence intensity was measured along transverse lines a–b at 4 different times during the centripetal propagation as indicated in upper panel; corresponding F/Fo ratio values were plotted in the lower panel to illustrate the progressive filling of the cytosol by Ca2+; video frames 1 and 4 (profiles 1 and 4 in lower panel) were sampled, respectively, at the stimulation and a few milliseconds prior to the peak of fluorescence intensity. The full sequence can be seen in the Supplemental Video 1 file.
Figure 3
Figure 3. Numerical simulation of centripetal Ca2+ mobilization in a segment of stimulated P-cell
A, simulation of Ca2+ spread over the full width of the cell; a segment of representative P-cell was selected as in Fig. 2; stimulation-evoked Cai variation was plotted in x–y directions for 5 selected times (T1–T5) of the propagation (T1 ∼ stimulation, T5 ∼ peak of the transient). The corresponding numerical simulations are represented below. Actual and simulated propagating fronts of elevated Cai (see text) were indicated on diagrams T3 and T4 by red arrows. Complete animated sequences are shown in Supplemental Videos 2 and 3. B, diagram showing the selection of cell region for numerical simulations based on the axial symmetry of the centripetal propagation. C, comparison between simulations (lower frames) and original observations (upper frames) of propagation time course over half-width of the cell. Although the model is generally based on a deterministic approach, stochasticity, which exists in the cell, was introduced in the simulations of panels A and C; to address the spatial heterogeneity of cellular Cai variations, the maximal number of channels per CRN (see Methods) obeyed a stochastic function as used previously by Liang et al. (2009); this maximum could vary between 20 and 100 channels per cluster.
Figure 4
Figure 4. Quantitative validation of the ‘3 regions’ model of centripetal Ca2+ mobilization
The spatiotemporal course of Ca2+ spread in a representative example of stimulated porcine P-cells (experiment NPC27–2–20) was assessed in half of a cell width along line a–b (see inset above A). The Ca2+ transient along a–b was measured at 5 different times T1–T5 in the cell (A) and corresponding simulation (B). Time course of the transients were characterized by measurements reported in Supplemental Table 3S. The simulation was implemented in the ‘3 Ca2+ release regions’ array as described in Fig. 1 and indicated here in panel B. C, Ca2+ efflux in regions 1, 2 and 3 was determined by the Ca2+ release pulse functions. Modelling and cell data were compared for each of T1–T5 profiles as shown for T3 in panel D. The results of comparisons of the model versus cell data are reported in Supplemental Table 2Sa.
Figure 5
Figure 5. Characterization of Ca2+ spread in cells and simulation
A, the spread of Ca2+ was characterized quantitatively by the maximal variation of Cai (Max) and linear spatial extent (FWHM). Max and FWHM were measured for cell and simulated T1–T5 transients of Fig. 4. The time courses of Max and FWHM were compared between cell and model in B and C, respectively.
Figure 6
Figure 6. Validation of the model on four different examples of centripetal propagation
The same modelling and comparative approaches used for the example in Fig. 4 were reproduced on 3 additional samples from 3 different cells (see Supplemental Material). A, the a–b distance and Ca2+ concentration were normalized to maximal cell width and maximal Ca2+ concentration, respectively, for each individual example (including the example shown in Fig. 4) and data for T1–T5 transients were averaged as shown in the figure (only averaged T1, T2 and T5 transients are represented). Averaged T1–T5 transients from the cells (line plots) and from corresponding simulations (surface plots) were superimposed for comparison in panel B.
Figure 7
Figure 7. Tests of different regional model arrangements
The numerical simulations represented in Figs 3–6 were carried out in a computational array in which regions 1, 2 and 3 were all active (see Reference Array above panels). Here 3 different arrangements were tested against the same cell samples; the predicted results (black curves) were compared with those from the cell (red curves). In scenario A,CRNs and CUNs were ‘turned off’ in regions 2 and 3 so that region 1 was the exclusive Ca2+ flux ‘generator’ in the model (panel a). The same initial Ca2+ release pulse (see Fig. 4C) was used in region 1. Simulated (black curves) and cell (red curves) T1–T5 transients were compared in panel b. FWHM and Max time courses were represented in panels c and d, respectively, and were statistically compared in Table 3. In scenario B, CRNs and CUNs of region 2 were inactive, simulating a potential gap in the ER distribution (panel a). Data generated by the model were compared with cell observations as described in panels b–d in A. In scenario C, CRNs had the same properties in regions 2 and 3 so that the computational array included 2 different Ca2+ release regions only (panel a). Data generated by the model were compared with cell observations as described in panels b–d in A. The same tests were implemented in the 3 additional examples shown in the Supplemental Material.
Figure 8
Figure 8. Effect of initial Cai elevation under the membrane
In the three different arrangements considered in the 3 scenarios of Fig. 7, the amplitude of simulated Ca2+ spread never reached the values measured in the cell centre. In the 3 scenarios, this result could be explained by an insufficient amount of Ca2+ released in region 1. This hypothesis was examined here for scenarios A, B and C by testing the effects of larger initial Cai elevations on the simulated centripetal Ca2+ spread. A, five increasing T1 transient amplitudes (black curves a–e) were imposed in region 1 and the corresponding effects on modelling of propagation were evaluated on the corresponding T5 transients (see blue curves a–e). T1 and T5 transients from the propagation measured in the cell were indicated in red for reference. The figure reports the results of the test implemented in scenario C. Here the amplitude was expressed as a percentage of the transient maximal amplitude (see horizontal dashed line) used in the successful ‘3 regions’ array simulations. This amplitude was identical to that measured in the cell (see red curve on the graph). The x-axis represents the distance from the centre to the boundary of the array. B, values of FWHM and Max of the T5 transients a–e were plotted against T1 transient amplitude. Black data points represented FWHM and Max values given by the model when the T1 amplitude had the value of the ‘3 regions’ simulations (Fig. 6). FWHM and Max from the cell T5 transient are indicated in each graph for reference (here T5/FWHM = 7.4 μm and T5/Max = 0.19 μm). The vertical dashed lines on the graphs highlight on x-axis the T1 value that is necessary to generate the T5/FWHM and T5/Max values of the cell reference.

Similar articles

Cited by

References

    1. Bassani JW, Bassani RA, Bers DM. Relaxation in rat and rabbit cardiac cells: species-dependent difference in cellular mechanisms. J Physiol. 1994;476:279–293. - PMC - PubMed
    1. Berlin JR, Bassani JW, Bers DM. Intrinsic cytosolic calcium buffering properties of single rat cardiac myocytes. Biophys J. 1994;67:1775–1787. - PMC - PubMed
    1. Boittin FX, Coussin F, Macrez N, Mironneau C, Mironneau J. Inositol 1,4,5-trisphosphate- and ryanodine-sensitive Ca2+ release channel-dependent Ca2+ signalling in rat portal vein myocytes. Cell Calcium. 1998;23:303–311. - PubMed
    1. Bondarenko VE, Bett GC, Rasmusson RL. A model of graded calcium release and L-type Ca2+ channel inactivation in cardiac muscle. Am J Physiol Heart Circ Physiol. 2004;286:H1154–H1169. - PubMed
    1. Boyden PA, Albala A, Dresdner KP., Jr Electrophysiology and ultrastructure of canine subendocardial Purkinje cells isolated from control and 24-hour infarcted hearts. Circ Res. 1989;65(4):955–970. - PubMed

Publication types

Substances

LinkOut - more resources