. 2013 Oct;33(19):3849-63.
doi: 10.1128/MCB.00731-13. Epub 2013 Jul 29.

BRG1 and BRM chromatin-remodeling complexes regulate the hypoxia response by acting as coactivators for a subset of hypoxia-inducible transcription factor target genes

Affiliations

BRG1 and BRM chromatin-remodeling complexes regulate the hypoxia response by acting as coactivators for a subset of hypoxia-inducible transcription factor target genes

Johnny A Sena et al. Mol Cell Biol. 2013 Oct.

Abstract

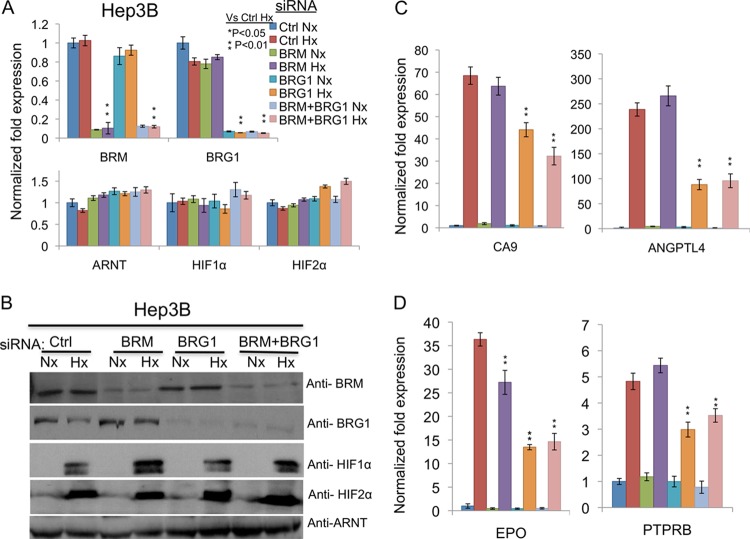
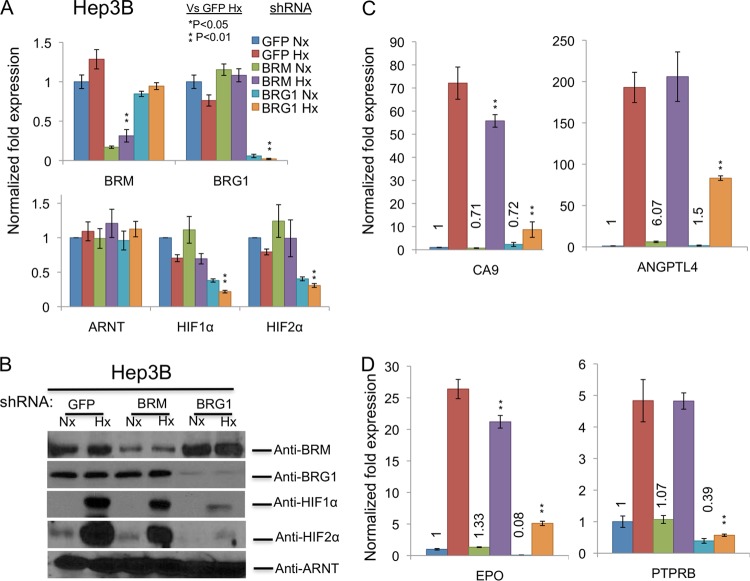
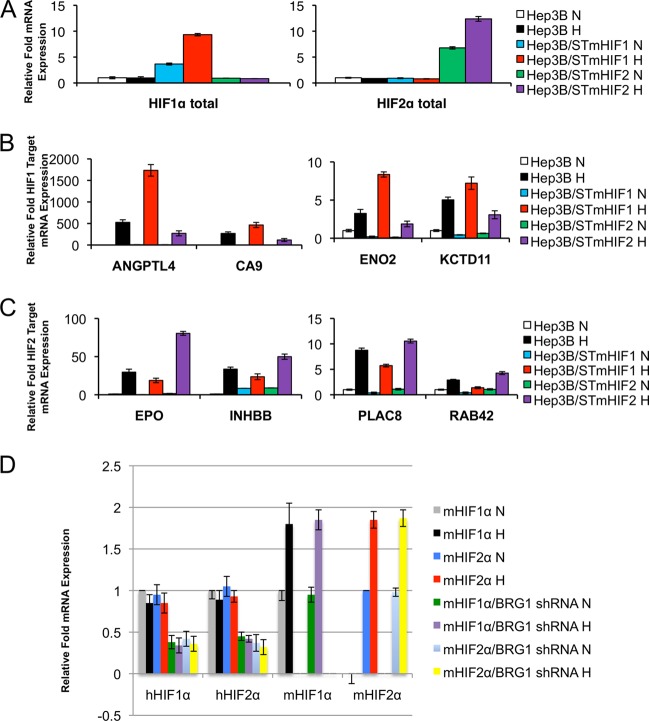
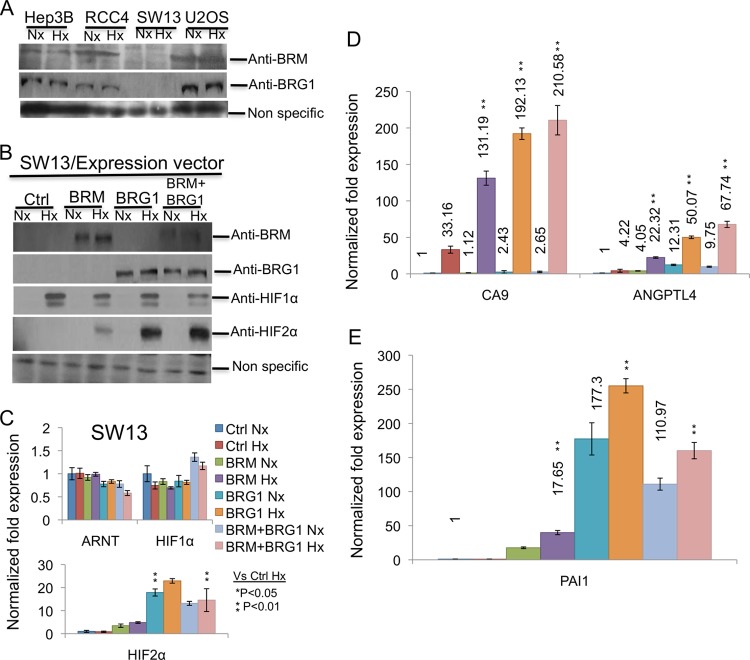
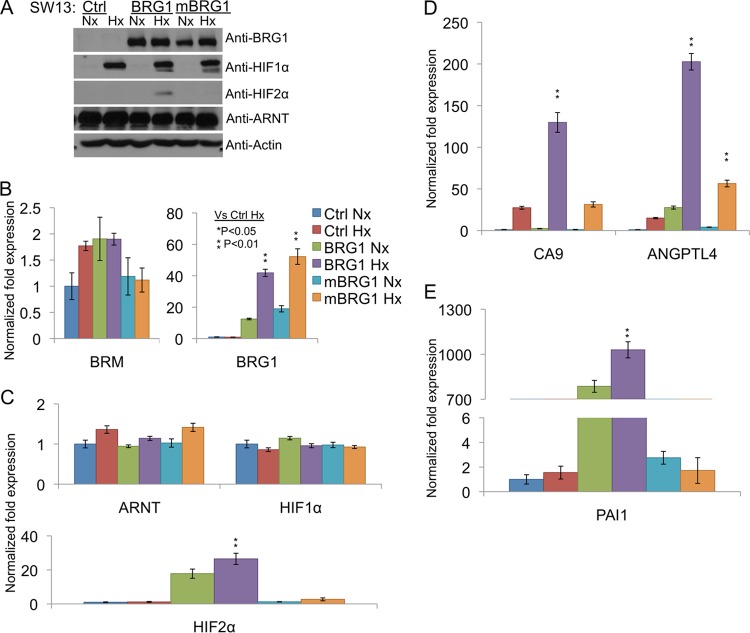
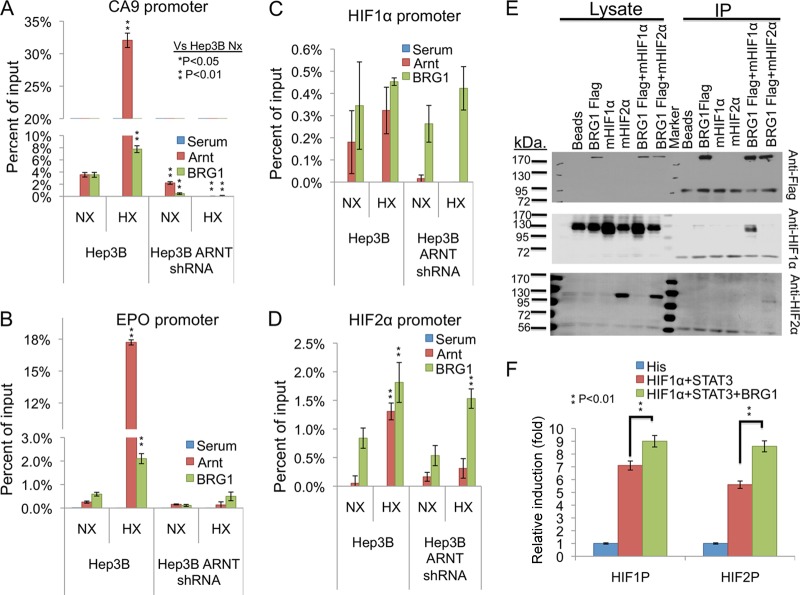
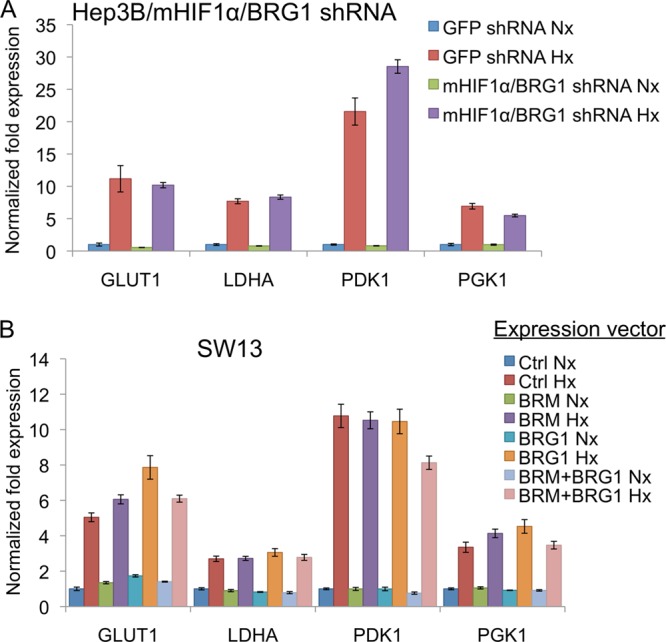
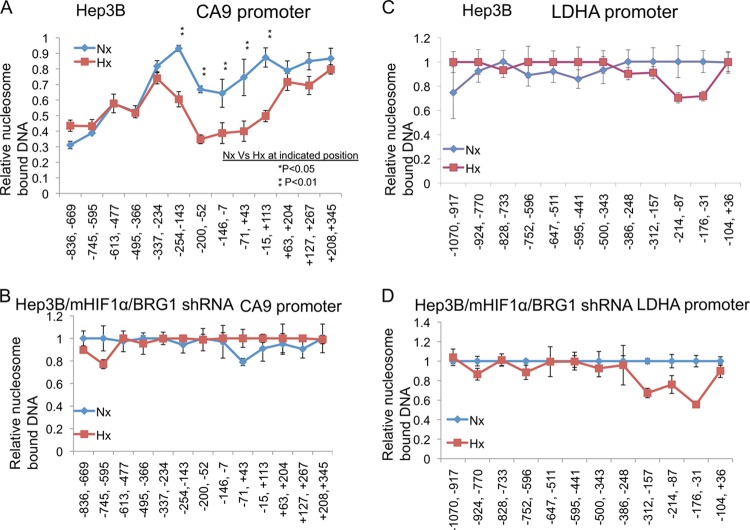
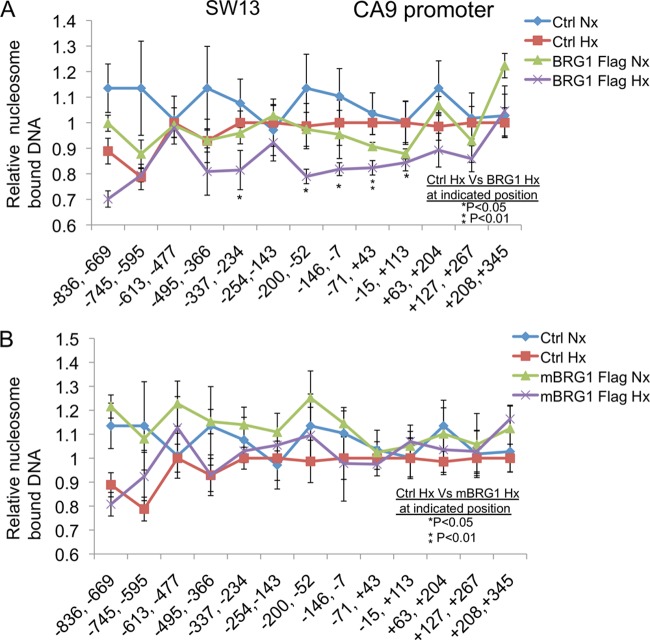
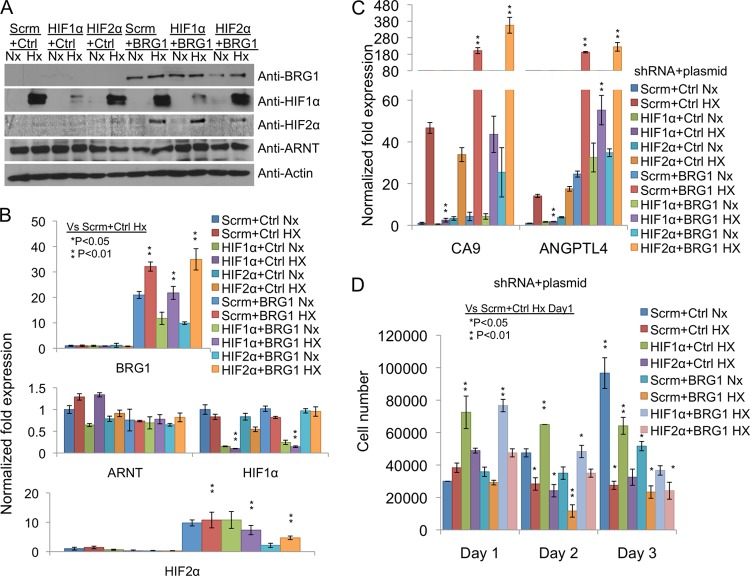
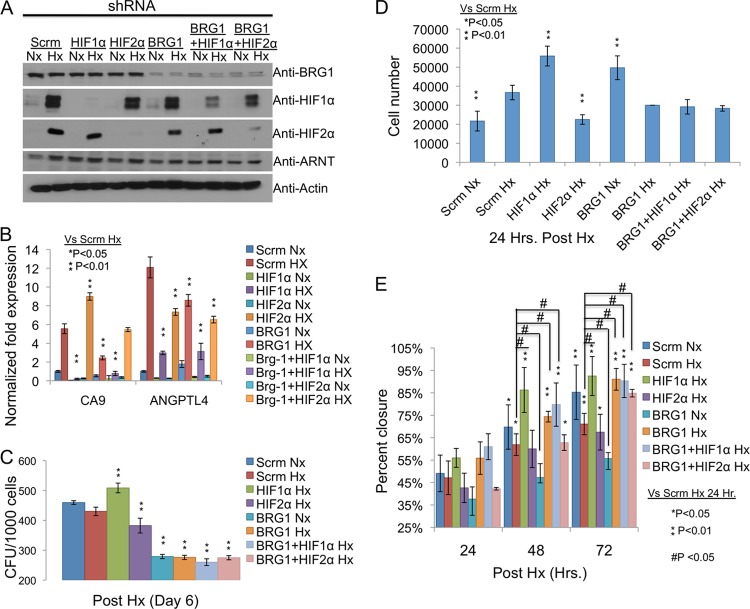
Chromatin remodeling is an active process, which represses or enables the access of transcription machinery to genes in response to external stimuli, including hypoxia. However, in hypoxia, the specific requirement, as well as the molecular mechanism by which the chromatin-remodeling complexes regulate gene expression, remains unclear. In this study, we report that the Brahma (BRM) and Brahma-related gene 1 (BRG1) ATPase-containing SWI/SNF chromatin-remodeling complexes promote the expression of the hypoxia-inducible transcription factor 1α (HIF1α) and HIF2α genes and also promote hypoxic induction of a subset of HIF1 and HIF2 target genes. We show that BRG1 or BRM knockdown in Hep3B and RCC4T cells reduces hypoxic induction of HIF target genes, while reexpression of BRG1 or BRM in BRG1/BRM-deficient SW13 cells increases HIF target gene activation. Mechanistically, HIF1 and HIF2 increase the hypoxic induction of HIF target genes by recruiting BRG1 complexes to HIF target gene promoters, which promotes nucleosome remodeling of HIF target gene promoters in a BRG1 ATPase-dependent manner. Importantly, we found that the function of BRG1 complexes in hypoxic SW13 and RCC4T cells is dictated by the HIF-mediated hypoxia response and could be opposite from their function in normoxic SW13 and RCC4T cells.


Figures

Fig 1
Fig 1
The BRG1 complex is more important than the BRM complex in regulating Hx induction of HIF target genes in Hep3B cells. RNA or protein was prepared from Nx and Hx Hep3B cells transfected with a control siRNA or with siRNAs targeting human BRM or BRG1 mRNA, or both. (A) RT-qPCR analysis of BRM, BRG1, HIF1α, HIF2α, and ARNT mRNA levels. (B) Western blot analysis of BRM, BRG1, HIF1α, HIF2α, and ARNT proteins. (C) RT-qPCR analysis of levels of the HIF1α target genes CA9 and ANGPTL4. (D) RT-qPCR analysis of levels of the HIF2α target genes EPO and PTPRB. qPCR data in this figure and other figures were normalized using the ΔΔCT method or as otherwise specified; 18S rRNA and β-actin mRNA were used as references, and wild-type Nx samples were used as a calibrator.
Fig 2
Fig 2
BRG1 but not BRM complexes are important in HIF1α and HIF2α gene transcription in Hep3B cells. Hep3B cells were stably transduced with a lentivirus expressing BRM or BRG1 shRNAs. RNA and protein were prepared from BRM or BRG1 knockdown Hep3B cells cultured under Nx or Hx. (A) RT-qPCR analysis of BRM, BRG1, ARNT, HIF1α, and HIF2α mRNA levels. (B) Western blot analysis of BRM, BRG1, HIF1α, HIF2α, and ARNT proteins. (C) RT-qPCR analysis of the mRNA levels of HIF1-specific targets CA9 and ANGPTL4. (D) RT-qPCR analysis of the mRNA levels of HIF2-specific targets EPO and PTPRB. Two different shRNAs for BRG1 or BRM produced identical results. Shown here are results from the BRG1 TRCN0000015549 and BRM TRCN0000020329 shRNAs.
Fig 3
Fig 3
BRG1 knockdown reduces endogenous HIF1α and HIF2α mRNA levels but not transfected mouse HIF1α or HIF2α mRNA levels. Hep3B cells were stably transfected with wild-type mouse HIF1α or mouse HIF2α Station (ST) vectors driven by the elongation factor 1 promoter. Hep3B/STmHIF1α or Hep3B/STmHIF2α cells were then targeted with a shRNA to stably knock down BRG1 mRNA. The cells were cultured under Nx (N) or Hx (H). (A) RT-qPCR detection of total (endogenous and transfected) HIF1α or HIF2α mRNA by primers detecting both mouse and human HIFα. Hx induction of mHIF1α or mHIF2α was due to the PGK1 promoter (controlling the hygromycin gene) in the Station vector, which is located upstream of the EF1 promoter. (B) RT-qPCR detection of mRNA levels of HIF1 target genes ANGPTL4, CA9, ENO2, and KCTD11. (C) RT-qPCR detection of mRNA levels of HIF2 target genes EPO, INHBB, PLAC8, and RAB42. (D) RT-qPCR detection of endogenous human HIF1α and HIF2α mRNAs and transfected mouse HIF1α and HIF2α mRNAs in the indicated cells.
Fig 4
Fig 4
BRG1 promotes Hx induction of HIF target genes in Hep3B cells. Hep3B cells were stably transfected with vectors expressing mouse HIF1α or mouse HIF2α protein. These Hep3B/mHIF1α or Hep3B/mHIF2α cells were used to stably knock down BRG1 mRNA. Protein and RNA were isolated from Nx and Hx Hep3B/GFP shRNA, Hep3B/mHIF1α/BRG1 shRNA, or Hep3B/mHIF2α/BRG1 shRNA cells. (A) RT-qPCR analysis of BRM and BRG1 mRNA levels. (B) Western blot analysis of BRM, BRG1, human HIF1α protein, human and mouse HIF1α protein, human and mouse HIF2α protein, and ARNT protein. Relative protein expression levels, obtained by using ARNT as a calibrator, are given below the blots. (C) RT-qPCR analysis of the mRNA levels of HIF1-specific targets CA9 and ENO2 in the indicated cells. (D) RT-qPCR analysis of the mRNA levels of HIF2-specific targets EPO and PTPRB in the indicated cells.
Fig 5
Fig 5
Reexpression of BRG1 or BRM in BRM/BRG1-deficient SW13 cells increases the expression of HIF2α and HIF target genes. (A) Western blot analysis of BRM and BRG1 proteins in Nx and Hx Hep3B, RCC4, SW13, and U2OS cells. (B through E) SW13 cells were transiently transfected with an empty vector (Ctrl) or with a vector expressing WT BRM, BRG1, or both. Thirty-two hours posttransfection, cells were cultured under Nx or Hx for 16 h. (B) Western blot analysis of BRM, BRG1, HIF1α, and HIF2α proteins. (C) RT-qPCR analysis of ARNT, HIF1α, and HIF2α mRNA levels. (D) RT-qPCR analysis of the mRNA levels of HIF1-specific genes CA9 and ANGPTL4. (E) RT-qPCR analysis of the mRNA levels of the HIF2-specific gene PAI1.
Fig 6
Fig 6
Reexpression of WT but not ATPase-dead BRG1 in BRM/BRG1-deficient SW13 cells increases the expression of HIF2α and HIF target genes. SW13 cells were transiently transfected with an empty vector (Ctrl) or a vector expressing WT (BRG1) or ATPase-dead (mBRG1) BRG1. Thirty-two hours posttransfection, cells were cultured under Nx or Hx for 16 h. (A) Western blot analysis of BRG1, HIF1α, HIF2α, and ARNT proteins. (B) RT-qPCR analysis of BRM and BRG1 mRNA levels. (C) RT-qPCR analysis of ARNT, HIF1α, and HIF2α mRNA levels. (D) RT-qPCR analysis of the mRNA levels of HIF1-specific genes CA9 and ANGPTL4. (E) RT-qPCR analysis of the mRNA level of the HIF2-specific gene PAI1.
Fig 7
Fig 7
Hx increases BRG1 binding on the promoters of CA9 and EPO in an ARNT-dependent manner. (A through D) ChIP analyses of ARNT and BRG1 binding on the promoters of the HIF1-specific gene CA9 (A), the HIF2-specific target EPO (B), the HIF1α gene (C), or the HIF2α gene (D) in Nx and Hx Hep3B cells or Hep3B/ARNT shRNA cells. (E) Co-IP of HIF1α or HIF2α with Flag-tagged BRG1 in hypoxic HEK293T cells. (F) Activation of a luciferase reporter driven by the HIF1α promoter (HIF1P) or the HIF2α promoter (HIF2P) by the empty vector (His) or by a vector carrying HIF1α plus STAT3 or HIF1α, STAT3, and BRG1 in 293T cells.
Fig 8
Fig 8
Hx induction of a subset of HIF target genes is BRM/BRG1 independent. (A) RT-qPCR analysis of mRNA levels of HIF1 target genes GLUT1, LDHA, PDK1, and PGK1 in Nx and Hx Hep3B/GFP shRNA or Hep3B/mHIF1α/BRG1 shRNA cells. (B) RT-qPCR analysis of mRNA levels of HIF1 target genes in Nx and Hx SW13 cells transiently transfected with a vector expressing either BRM, BRG1, or both BRM and BRG1.
Fig 9
Fig 9
Hx decreases nucleosome association on the CA9 promoter in a BRG1-dependent manner. (A and B) Nucleosome scanning assays of the CA9 promoter in Nx or Hx Hep3B (A) or Hep3B/mHIF1α/BRG1 shRNA (B) cells. (C and D) Nucleosome scanning assays of the LDHA promoter in Nx or Hx Hep3B (C) or Hep3B/mHIF1α/BRG1 shRNA (D) cells. The location of each primer set is given relative to the transcription start site, designated +1. qPCR data were quantified using the ΔCT method. For CA9 in Hep3B cells, a region spanning +273 to +407 was used as an internal control, since this region did not differ between Nx and Hx cells. For LDHA, a region spanning +20 to +117 was used as an internal control. Relative percentages of nucleosome-bound DNA in this figure and Fig. 10 represent the levels of nucleosome-bound DNA relative to those for internal controls. For this figure, t tests were performed for Nx versus Hx samples for each corresponding position.
Fig 10
Fig 10
Reintroduction of wild-type but not ATPase-dead BRG1 into SW13 cells decreases nucleosome association on the CA9 promoter. Shown are results of nucleosome scanning assays of the CA9 promoter in Nx or Hx SW13 cells transiently transfected with an empty vector or a vector expressing wild-type BRG1 (BRG1) (A) or ATPase-dead BRG1 (mBRG1) (B). qPCR data were quantified using the ΔCT method; a region spanning positions −214 to −87 was used as an internal control, since nucleosome association on this region did not differ between Nx and Hx cells or between cells transfected with BRG1-Flag and cells transfected with mBRG1-Flag.
Fig 11
Fig 11
Reintroduction of BRG1 into SW13 cells increases the HIF-mediated Hx response and HIF-mediated growth-suppressive activity. SW13 cells were transduced with a shRNA against nontargeting scrambled RNA (Scrm) or against HIF1α or HIF2α mRNA. These cells were then transiently transfected with an empty vector (Ctrl) or with a vector expressing BRG1. (A to C) Thirty-two hours posttransfection, cells were cultured under Nx or Hx for 16 h. (A) Western blot analysis of BRG1, HIF1α, HIF2α, and ARNT. (B) RT-qPCR analysis of BRG1, ARNT, HIF1α, and HIF2α mRNA. (C) RT-qPCR analysis of HIF target genes CA9 and ANGPTL4. (D) Cell proliferation assay. Thirty-two hours posttransfection, cells were cultured under Nx or Hx for an additional 24, 48, or 72 h. To avoid crowding, Nx SW13/HIF1α+Ctrl, SW13/HIF2α+Ctrl, SW13/HIF1α+BRG1, and SW13/HIF2α+BRG1 cells were not included in the figure; the first two types of cells exhibited patterns similar to those of Nx SW13/Scrm+Ctrl cells, and the latter two exhibited patterns similar to those of Nx SW13/Scrm+BRG1 cells.
Fig 12
Fig 12
The HIF-mediated Hx response dictates the role of the BRG1 complex in the proliferation and migration of hypoxic RCC4T cells. RCC4T cells were transduced with a shRNA against nontargeting scrambled RNA (Scrm), HIF1α, HIF2α, BRG1, BRG1 plus HIF1α, or BRG1 plus HIF2α. These cells were cultured under Nx or Hx. (A) Western blot analysis of BRG1, HIF1α, HIF2α, and ARNT. (B) RT-qPCR analysis of HIF target genes CA9 and ANGPTL4. (C) Clonogenic survival assay. (D) Cell proliferation assay for a 24-h culture. (E) Wound-healing cell migration assay. To avoid crowding, data for Nx RCC4T/HIF1α shRNA cells, Nx RCC4T/HIF2α shRNA cells, Nx RCC4T/BRG1+HIF1α shRNA cells, and Nx RCC4T/BRG1+HIF2α shRNA cells were not included in panels C to E; the first two types of cells exhibited patterns similar to those of Nx RCC4T/Scrm cells, and the latter two exhibited patterns similar to those of Nx RCC4T/BRG1 shRNA cells.

Similar articles

Cited by

References

    1. Finger EC, Giaccia AJ. 2010. Hypoxia, inflammation, and the tumor microenvironment in metastatic disease. Cancer Metastasis Rev. 29:285–293 - PMC - PubMed
    1. Kaelin WG., Jr 2011. Cancer and altered metabolism: potential importance of hypoxia-inducible factor and 2-oxoglutarate-dependent dioxygenases. Cold Spring Harb. Symp. Quant. Biol. 76:335–345 - PMC - PubMed
    1. Keith B, Johnson RS, Simon MC. 2012. HIF1α and HIF2α: sibling rivalry in hypoxic tumour growth and progression. Nat. Rev. Cancer 12:9–22 - PMC - PubMed
    1. Semenza GL. 2012. Hypoxia-inducible factors in physiology and medicine. Cell 148:399–408 - PMC - PubMed
    1. Bruick RK. 2000. Expression of the gene encoding the proapoptotic Nip3 protein is induced by hypoxia. Proc. Natl. Acad. Sci. U. S. A. 97:9082–9087 - PMC - PubMed

Publication types

MeSH terms

Substances

LinkOut - more resources