Control of energy balance by hypothalamic gene circuitry involving two nuclear receptors, neuron-derived orphan receptor 1 and glucocorticoid receptor
- PMID: 23897430
- PMCID: PMC3811874
- DOI: 10.1128/MCB.00385-13
Control of energy balance by hypothalamic gene circuitry involving two nuclear receptors, neuron-derived orphan receptor 1 and glucocorticoid receptor
Abstract
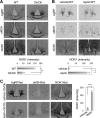
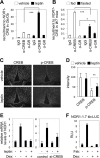
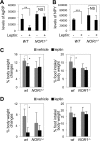
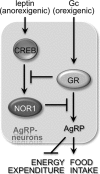
Nuclear receptors (NRs) regulate diverse physiological processes, including the central nervous system control of energy balance. However, the molecular mechanisms for the central actions of NRs in energy balance remain relatively poorly defined. Here we report a hypothalamic gene network involving two NRs, neuron-derived orphan receptor 1 (NOR1) and glucocorticoid receptor (GR), which directs the regulated expression of orexigenic neuropeptides agouti-related peptide (AgRP) and neuropeptide Y (NPY) in response to peripheral signals. Our results suggest that the anorexigenic signal leptin induces NOR1 expression likely via the transcription factor cyclic AMP response element-binding protein (CREB), while the orexigenic signal glucocorticoid mobilizes GR to inhibit NOR1 expression by antagonizing the action of CREB. Also, NOR1 suppresses glucocorticoid-dependent expression of AgRP and NPY. Consistently, relative to wild-type mice, NOR1-null mice showed significantly higher levels of AgRP and NPY and were less responsive to leptin in decreasing the expression of AgRP and NPY. These results identify mutual antagonism between NOR1 and GR to be a key rheostat for peripheral metabolic signals to centrally control energy balance.
Figures


Similar articles
-
AgRP Neuron-Specific Deletion of Glucocorticoid Receptor Leads to Increased Energy Expenditure and Decreased Body Weight in Female Mice on a High-Fat Diet.Endocrinology. 2016 Apr;157(4):1457-66. doi: 10.1210/en.2015-1430. Epub 2016 Feb 18. Endocrinology. 2016. PMID: 26889940
-
Brain-specific homeobox factor as a target selector for glucocorticoid receptor in energy balance.Mol Cell Biol. 2013 Jul;33(14):2650-8. doi: 10.1128/MCB.00094-13. Epub 2013 May 13. Mol Cell Biol. 2013. PMID: 23671185 Free PMC article.
-
Signal transducer and activator of transcription-3 is required in hypothalamic agouti-related protein/neuropeptide Y neurons for normal energy homeostasis.Endocrinology. 2008 Jul;149(7):3346-54. doi: 10.1210/en.2007-0945. Epub 2008 Apr 10. Endocrinology. 2008. PMID: 18403487 Free PMC article.
-
Central mechanisms involved in the orexigenic actions of ghrelin.Peptides. 2011 Nov;32(11):2248-55. doi: 10.1016/j.peptides.2011.05.014. Epub 2011 May 17. Peptides. 2011. PMID: 21619904 Review.
-
Gq-mER signaling has opposite effects on hypothalamic orexigenic and anorexigenic neurons.Steroids. 2014 Mar;81:31-5. doi: 10.1016/j.steroids.2013.11.007. Epub 2013 Nov 20. Steroids. 2014. PMID: 24269736 Free PMC article. Review.
Cited by
-
Single-Nucleus RNA Sequencing of the Hypothalamic Arcuate Nucleus of C57BL/6J Mice After Prolonged Diet-Induced Obesity.Hypertension. 2020 Aug;76(2):589-597. doi: 10.1161/HYPERTENSIONAHA.120.15137. Epub 2020 Jun 8. Hypertension. 2020. PMID: 32507042 Free PMC article.
-
Gender-specific alteration of energy balance and circadian locomotor activity in the Crtc1 knockout mouse model of depression.Transl Psychiatry. 2017 Dec 8;7(12):1269. doi: 10.1038/s41398-017-0023-4. Transl Psychiatry. 2017. PMID: 29217834 Free PMC article.
-
The LIM-homeobox transcription factor Isl1 plays crucial roles in the development of multiple arcuate nucleus neurons.Development. 2016 Oct 15;143(20):3763-3773. doi: 10.1242/dev.133967. Epub 2016 Aug 30. Development. 2016. PMID: 27578785 Free PMC article.
-
The gut signals to AGRP-expressing cells of the pituitary to control glucose homeostasis.J Clin Invest. 2023 Apr 3;133(7):e164185. doi: 10.1172/JCI164185. J Clin Invest. 2023. PMID: 36787185 Free PMC article.
-
Feeding Rhythm-Induced Hypothalamic Agouti-Related Protein Elevation via Glucocorticoids Leads to Insulin Resistance in Skeletal Muscle.Int J Mol Sci. 2021 Oct 7;22(19):10831. doi: 10.3390/ijms221910831. Int J Mol Sci. 2021. PMID: 34639172 Free PMC article.
References
-
- Ellacott KL, Cone RD. 2004. The central melanocortin system and the integration of short- and long-term regulators of energy homeostasis. Recent Prog. Horm. Res. 59:395–408 - PubMed
-
- Seeley RJ, Drazen DL, Clegg DJ. 2004. The critical role of the melanocortin system in the control of energy balance. Annu. Rev. Nutr. 24:133–149 - PubMed
-
- Bantubungi K, Prawitt J, Staels B. 2012. Control of metabolism by nutrient-regulated nuclear receptors acting in the brain. J. Steroid Biochem. Mol. Biol. 130:126–137 - PubMed
Publication types
MeSH terms
Substances
Grants and funding
LinkOut - more resources
Full Text Sources
Other Literature Sources
Molecular Biology Databases
Miscellaneous
