. 2013 Oct;33(19):3879-92.
doi: 10.1128/MCB.05772-11. Epub 2013 Jul 29.

Erythropoietic defect associated with reduced cell proliferation in mice lacking the 26S proteasome shuttling factor Rad23b

Affiliations

Erythropoietic defect associated with reduced cell proliferation in mice lacking the 26S proteasome shuttling factor Rad23b

Steven Bergink et al. Mol Cell Biol. 2013 Oct.

Abstract

Rad23a and Rad23b proteins are linked to nucleotide excision DNA repair (NER) via association with the DNA damage recognition protein xeroderma pigmentosum group C (XPC) are and known to be implicated in protein turnover by the 26S proteasome. Rad23b-null mice are NER proficient, likely due to the redundant function of the Rad23b paralogue, Rad23a. However, Rad23b-null midgestation embryos are anemic, and most embryos die before birth. Using an unbiased proteomics approach, we found that the majority of Rad23b-interacting partners are associated with the ubiquitin-proteasome system (UPS). We tested the requirement for Rad23b-dependent UPS activity in cellular proliferation and more specifically in the process of erythropoiesis. In cultured fibroblasts derived from embryos lacking Rad23b, proliferation rates were reduced. In fetal livers of Rad23b-null embryos, we observed reduced proliferation, accumulation of early erythroid progenitors, and a block during erythroid maturation. In primary wild-type (WT) erythroid cells, knockdown of Rad23b or chemical inhibition of the proteasome reduced survival and differentiation capability. Finally, the defects linked to Rad23b loss specifically affected fetal definitive erythropoiesis and stress erythropoiesis in adult mice. Together, these data indicate a previously unappreciated requirement for Rad23b and the UPS in regulation of proliferation in different cell types.


Figures

Fig 1
Fig 1
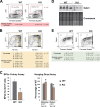
Rad23b-null embryos at 13.5 dpc display anemia. (A) Representative pictures of WT and Rad23b-null (KO) embryos (upper two rows) with fetal livers surrounded by red lines and of fetal livers (lower row). (B) Fetal liver total cell count. WT, n = 14; KO, n = 12. Cytospins of fetal liver cell suspensions are depicted. Note the reduction of maturing cells in the KO sample. (C) Embryonic blood total cell count at 11.5 dpc (WT, n = 8; KO, n = 7) and 13.5 dpc (WT, n = 10; KO, n = 8). (D) Analysis of 13.5-dpc embryonic blood. Upper left, ratio of enucleated to nucleated erythroid cells. Upper right, absolute number of nucleated blood cells. Lower left, absolute number of enucleated blood cells. Lower right, absolute number of primitive enucleated blood cells, as calculated using flow cytometry. SSC, side scatter. Asterisks indicate statistical significance.
Fig 2
Fig 2
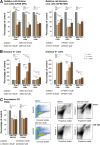
Defective definitive erythropoiesis in Rad23b-null embryos. (A) Representative flow cytometric analysis of cKit expression in fetal livers of WT and Rad23b-null (KO) embryos. The percentage of live cKit+ cells is depicted in the contour plots of representative WT and KO livers. Absolute numbers (average and standard deviation [SD] for WT [n = 14] and KO [n = 12]) are indicated in the table. (B) Flow cytometric analysis of CD71 and Ter119 expression in fetal livers of WT and KO embryos. Populations I to IV represent subsequent stages during erythroid maturation (44). The percentage of live cells and the absolute numbers are indicated in the table as average and SD (WT, n = 14; KO, n = 12). (C) Bar graphs representing burst-forming unit erythroid (BFUe) colony assays and hanging-drop erythroid differentiation culture. Asterisks indicate statistical significance. (D) Western blot analysis of Gata1 expression in fetal liver cells. The same number of cells was used per lane. Coomassie blue staining is shown as loading control. (E) Flow cytometric analysis of intracellular Gata1 expression in fetal livers of WT and KO embryos. Populations I (FSChigh Gata1high) and II (FSClow Gata1low) represent subsequent stages during erythroid maturation. The percentage of live cells and the absolute numbers are indicated in the table as average and SD (WT, n = 14; KO, n = 12).
Fig 3
Fig 3
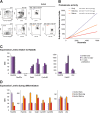
Proliferation defect in Rad23b-null cells. (A) Proliferation of WT and KO embryonic fibroblasts at 3% and 20% O2 tension. (B) Proliferation of WT and KO embryonic fibroblasts plated at low and high density upon serial passaging at 3% O2 tension. (C) Expansion of WT and KO fetal liver erythroid cells cultured under conditions that favor the proliferation of early erythroid progenitors, preventing their differentiation. (D) Hanging-drop CFSE erythroid differentiation culture showing relative proliferation differences between WT and KO erythroid cells. Asterisks indicate statistical significance.
Fig 4
Fig 4
Intrinsic proliferation defect in Rad23b knockdown erythroid cells. (A) The relative fold enrichment (RFE) of cDNA expression as calculated by qPCR is shown for Rad23b and Ubc. Several shRNA constructs were used to knock down Rad23b or Ubc, and control cells were transduced with a scrambled shRNA lentivirus construct (Scr). P, proliferation conditions; D, differentiation conditions. Cytospins of knockdown cells under proliferation or differentiation conditions are depicted in the lower panels. (B) Cell number (left) and cell cycle analysis (right) after 2 days under proliferation conditions, starting with 5 × 10⁶ cells. Rad23 knockdown (R KD) or Ubc knockdown (U KD) cells fail to proliferate and/or die compared to the cells transduced with a scrambled shRNA lentivirus construct (Scr). Dead cells were scored as small cells (<4 μm) in the CASY cell counter, and percentages were confirmed by 7AAD staining and flow cytometry (not shown). The average and SD are depicted for the 4 Rad23b shRNA lentivirus-transduced cells. (C) Cell number (left) and cell cycle analysis (right) after 2 days under differentiation conditions, starting with 5 × 10⁶ cells. Rad23 knockdown (R KD) or Ubc knockdown (U KD) cells fail to proliferate and/or die compared to the cells transduced with a scrambled shRNA lentivirus construct (Scr). Dead cells were scored as small cells (<4 μm) in the CASY cell counter, and percentages were confirmed by 7AAD staining and flow cytometry (not shown, 7AAD+). Differentiating cells were scored as smaller than 7 μm in the CASY cell counter, and percentages were confirmed by flow cytometry (not shown, 7AAD FSClow). The average and SD are depicted for the Rad23b or Ubc shRNA lentivirus-transduced cells.
Fig 5
Fig 5
Proteasome activity is required early during erythroid differentiation. (A) Western blot analysis of poly- and monoubiquitylated proteins and Gata1 expression in 13.5-dpc fetal liver at the day of collection (D0) or at day 1 after hanging-drop culture (HD D1) under standard (ST) conditions or in the presence of the proteasome inhibitor MG132. Loading was normalized by cell number. (B) Flow cytometry analysis of standard (ST) or MG132-treated hanging-drop cultures at the onset of cultures (T D0) and analyzed at day 1 or 2 of culture (+24 h or + 48 h) or treated after 1 day in hanging-drop culture (T D1) and analyzed a day later (+24 h). The percentage of live cells, the mean size of dead (7AAD+) cells, and the mean size of Ter119+ cells are depicted. *, P < 0.005. Values are normalized to those for untreated cultures.
Fig 6
Fig 6
Effects of proteasome inhibitors on erythropoiesis depend on differentiation status. (A) Relative cell proliferation as measured by CFSE mean fluorescence intensity (MFI) after culturing I/11 cells for 24 h in the presence of MG132 or PS341 proteasome inhibitor at the concentrations and culture stages indicated. (B) Percentage of annexin V-positive cells after culturing I/11 cells for 24 h in the presence of MG132 or PS341 proteasome inhibitor at the concentrations and culture stages indicated. Representative density plots are depicted below. (C) Percentage of enucleation, as measured by flow cytometry (Hoechst intermediate, forward scatter small) after culturing I/11 cells for 24 h in the presence of MG132 or PS341 proteasome inhibitor at the indicated concentrations on day 2 of differentiation (analysis was done on day 3). The results of one representative experiment out of three are depicted in the dot plots.
Fig 7
Fig 7
Proteasome activity is required early during erythroid differentiation. (A) Flow cytometry gating strategy to sort prospectively erythroid cells at different stages of maturation from fetal livers. The order from immature to more mature is as follows: early, cKit+ CD71+ Ter119; maturing, cKit CD71+ Ter119+; mature, cKit CD71 Ter119+. Respective contour plots showing the purity of sorted populations are depicted. (B) Proteasome activity of representative prospectively isolated erythroid populations. (C) mRNA expression levels as measured by qPCR of Rad23b and other transcripts in early FACS-sorted erythroid cells, 12.5-dpc fetal liver cells, and proliferating I/11 cells. Relative fold enrichment (RFE) is depicted, setting Rad23b to 100. (D) mRNA expression levels as measured by qPCR of Rad23b and other transcripts measured by qPCR during erythroid differentiation in FACS-sorted erythroid populations. Relative fold enrichment (RFE) is depicted, setting the early cell population to 100 for each transcript. Representative analyses are shown.
Fig 8
Fig 8
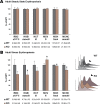
Rad23b-null chimeric mice show a delayed stress erythropoiesis response. (A) Blood hematological parameters of Rad23b-null and WT chimeric mice 6 weeks after transplantation measured on a Vet ABC hematocytocounter. (B) Blood hematological parameters of Rad23b-null and WT chimeric mice 8 weeks after transplantation and 5 days after hemolysis induction with PHZ. Asterisks indicate statistical significance. RBC, red blood cell; HGB, hemoglobin; HCT, hematocrit; MCV, mean cell volume; MCH, mean corpuscular hemoglobin; MCHC, mean cellular hemoglobin concentration. Histogram overlays on the right show the scatter of RBC, with arrowheads pointing to reticulocyte peaks.

Similar articles

Cited by

References

    1. Dantuma NP, Heinen C, Hoogstraten D. 2009. The ubiquitin receptor Rad23: at the crossroads of nucleotide excision repair and proteasomal degradation. DNA Repair (Amst.) 8:449–460 - PubMed
    1. Hiyama H, Yokoi M, Masutani C, Sugasawa K, Maekawa T, Tanaka K, Hoeijmakers JH, Hanaoka F. 1999. Interaction of hHR23 with S5a. The ubiquitin-like domain of hHR23 mediates interaction with S5a subunit of 26 S proteasome. J. Biol. Chem. 274:28019–28025 - PubMed
    1. van der Spek PJ, Visser CE, Hanaoka F, Smit B, Hagemeijer A, Bootsma D, Hoeijmakers JH. 1996. Cloning, comparative mapping, and RNA expression of the mouse homologues of the Saccharomyces cerevisiae nucleotide excision repair gene RAD23. Genomics 31:20–27 - PubMed
    1. Miller RD, Prakash L, Prakash S. 1982. Defective excision of pyrimidine dimers and interstrand DNA crosslinks in rad7 and rad23 mutants of Saccharomyces cerevisiae. Mol. Gen. Genet. 188:235–239 - PubMed
    1. Ng JM, Vermeulen W, van der Horst GT, Bergink S, Sugasawa K, Vrieling H, Hoeijmakers JH. 2003. A novel regulation mechanism of DNA repair by damage-induced and RAD23-dependent stabilization of xeroderma pigmentosum group C protein. Genes Dev. 17:1630–1645 - PMC - PubMed

Publication types

MeSH terms

Substances