. 2013 Aug;69(Pt 8):1447-62.
doi: 10.1107/S0907444913009050. Epub 2013 Jul 17.

On the reproducibility of protein crystal structures: five atomic resolution structures of trypsin

Affiliations

On the reproducibility of protein crystal structures: five atomic resolution structures of trypsin

Dorothee Liebschner et al. Acta Crystallogr D Biol Crystallogr. 2013 Aug.

Abstract

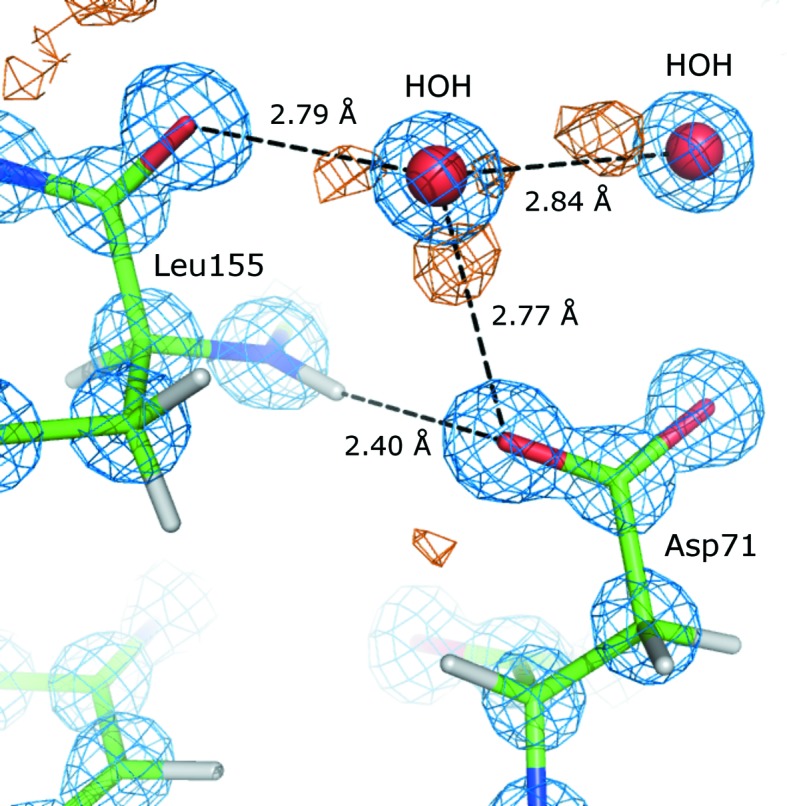
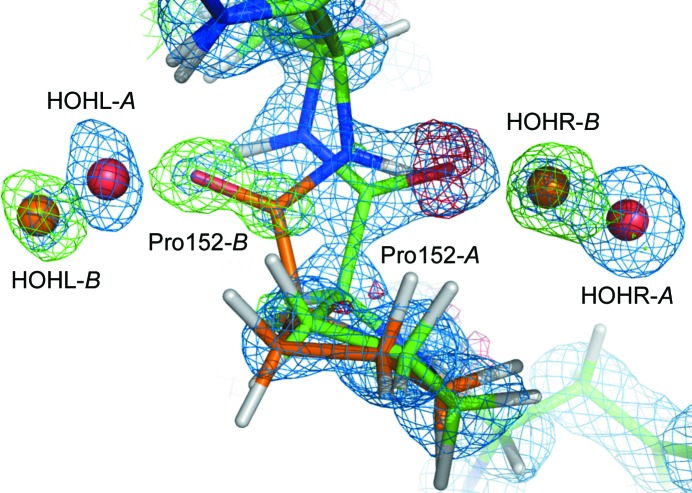
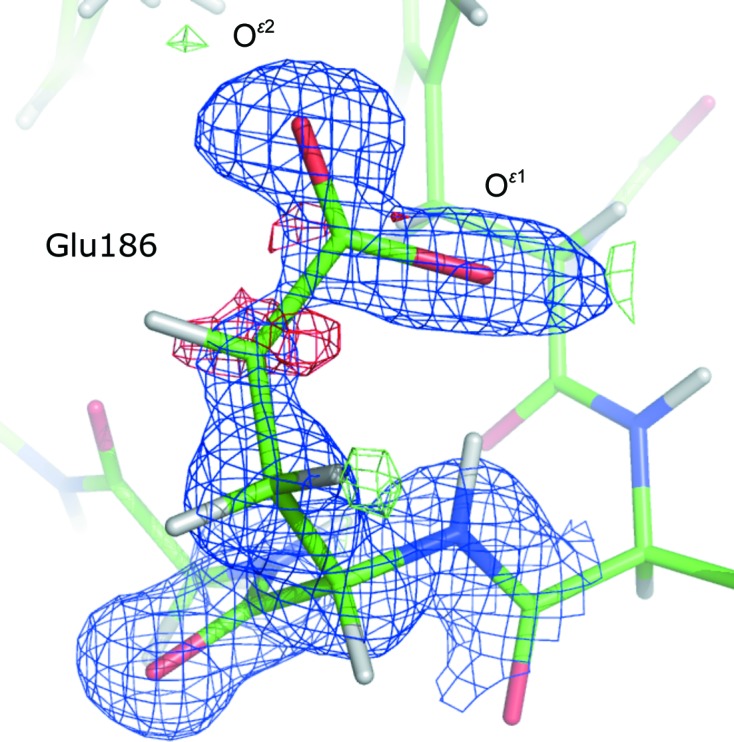
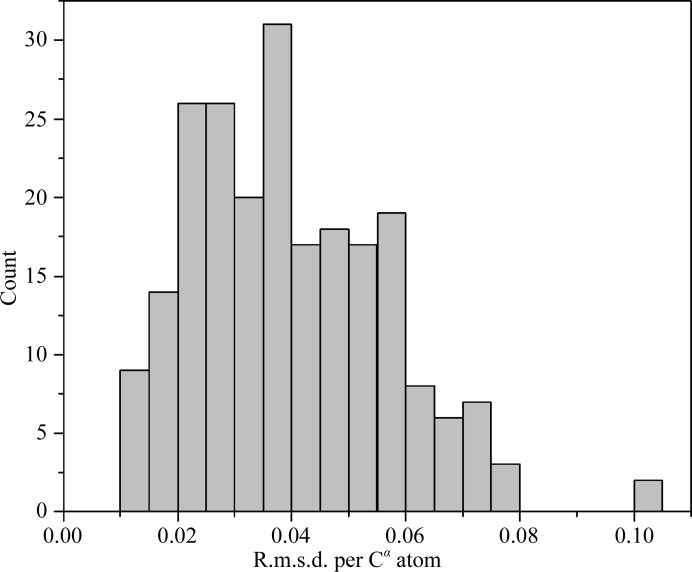
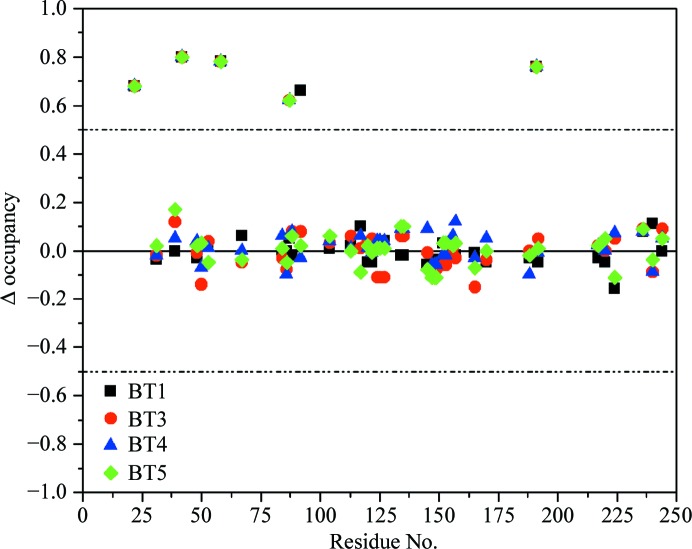
Structural studies of proteins usually rely on a model obtained from one crystal. By investigating the details of this model, crystallographers seek to obtain insight into the function of the macromolecule. It is therefore important to know which details of a protein structure are reproducible or to what extent they might differ. To address this question, the high-resolution structures of five crystals of bovine trypsin obtained under analogous conditions were compared. Global parameters and structural details were investigated. All of the models were of similar quality and the pairwise merged intensities had large correlation coefficients. The C(α) and backbone atoms of the structures superposed very well. The occupancy of ligands in regions of low thermal motion was reproducible, whereas solvent molecules containing heavier atoms (such as sulfur) or those located on the surface could differ significantly. The coordination lengths of the calcium ion were conserved. A large proportion of the multiple conformations refined to similar occupancies and the residues adopted similar orientations. More than three quarters of the water-molecule sites were conserved within 0.5 Å and more than one third were conserved within 0.1 Å. An investigation of the protonation states of histidine residues and carboxylate moieties was consistent for all of the models. Radiation-damage effects to disulfide bridges were observed for the same residues and to similar extents. Main-chain bond lengths and angles averaged to similar values and were in agreement with the Engh and Huber targets. Other features, such as peptide flips and the double conformation of the inhibitor molecule, were also reproducible in all of the trypsin structures. Therefore, many details are similar in models obtained from different crystals. However, several features of residues or ligands located in flexible parts of the macromolecule may vary significantly, such as side-chain orientations and the occupancies of certain fragments.

Keywords: atomic resolution; structural reproducibility; structure comparison; trypsin.


Figures

Figure 1
Figure 1
Cartoon representation of the BT1–inhibitor complex. Helices and sheets are represented in red and blue, respectively. Inhibitor and solvent molecules are represented as sticks.
Figure 2
Figure 2
Coordination of the calcium ion in structure BT2. The blue 2F obsF calc electron-density map is contoured at 3.0σ.
Figure 3
Figure 3
Close-up view of the benzamidine inhibitor molecule in model BT5 illustrating the double conformation. The 2F obsF calc electron-density map (blue) is contoured at 2σ. Note the elongated shape of the electron-density peaks in the phenyl group. Conformations A and B of BEN are represented in orange and green, respectively.
Figure 4
Figure 4
The vicinity of the three histidine residues in BT. The 2F obsF calc electron-density map (blue) is contoured at 2.0σ and the positive F obs − F calc difference map (orange) is contoured at 2.5σ. For better visibility, the surrounding residues are not displayed. (a) His40 in BT2: the electron density peaks corresponding to the H atoms of N∊2 and of the Ser32 hydroxyl group are clearly visible. (b) His57 in BT5 is doubly protonated. (c) His91 in BT3; N∊2 is protonated.
Figure 5
Figure 5
The vicinity of the Oδ1 atom of Asp71 in BT3. The 2F obsF calc electron-density map (blue) is contoured at 2.5σ and the positive F obs − F calc difference map (orange) is contoured at 2.7σ. For better visibility, the surrounding residues are not displayed. Hydrogen-bond interactions are indicated as black lines. Note the canonical O⋯O distances involving the water molecules.
Figure 6
Figure 6
Flip of the Pro152-Asp153 peptide unit in BT. The electron-density map of an earlier refinement step (in which the double conformation had not yet been modeled) is superposed on the final BT2 model. The 2F obs − F calc electron-density map (blue) is contoured at 1.0σ and the positive (green) and negative (red) F obsF calc difference maps are contoured at 2.5σ and −2.5σ, respectively. For better visibility, the surrounding residues and parts of the map are not displayed. The B conformation is colored orange.
Figure 7
Figure 7
Close-up of Glu186 in BT4. The 2F obsF calc electron-density map (blue) is contoured at 1.0σ and the positive (green) and negative (red) F obs − F calc difference maps are contoured at 3.0σ and −3.0σ, respectively.
Figure 8
Figure 8
Distribution of the positional r.m.s.d.s between Cα atoms without taking double conformations into account. Most atoms shift by about 0.03 Å in the five models.
Figure 9
Figure 9
Differences between the occupancies of multiple conformations in BT2 and the other models (BT1, BT3, BT4 and BT5).
Figure 10
Figure 10
The Lys87 side chain in (a) BT5 and (b) BT2. The 2F obsF calc electron-density map (blue) is contoured at 1.0σ and the positive (green) and negative (red) F obsF calc difference maps are contoured at 3σ and −3σ, respectively. For better visibility, the surrounding residues and parts of the map are not displayed. The B conformation is colored orange. The B conformation was not present in the model in the calculation of the maps.
Figure 11
Figure 11
Different possibilities for modeling water molecules in elongated electron-density peaks. Left column, BT2; right column, BT4. (a) No water molecules, (b) one water molecule with anisotropic ADPs, (c) two water molecules with isotropic and (d) anisotropic ADPs. The 2F obs − F calc electron-density map (blue) is contoured at 1.0σ and the positive (green) and negative (red) F obsF calc difference maps are contoured at 3σ and −3σ, respectively. The thermal ellipsoids are displayed with a 50% probability surface.

Similar articles

Cited by

References

    1. Adams, P. D. et al. (2010). Acta Cryst. D66, 213–221. - PubMed
    1. Addlagatta, A., Krzywda, S., Czapinska, H., Otlewski, J. & Jaskolski, M. (2001). Acta Cryst. D57, 649–663. - PubMed
    1. Afonine, P. V., Grosse-Kunstleve, R. W. & Adams, P. D. (2005). CCP4 Newsl. Protein Crystallogr. 42, contribution 8.
    1. Allen, F. H. (2002). Acta Cryst. B58, 380–388. - PubMed
    1. Ashida, T., Tsunogae, Y., Tanaka, I. & Yamane, T. (1987). Acta Cryst. B43, 212–218.

Publication types