

Translational paradigms in scientific and clinical imaging of cardiac development
- PMID: 23897595
- PMCID: PMC4472488
- DOI: 10.1002/bdrc.21034
Translational paradigms in scientific and clinical imaging of cardiac development
Abstract
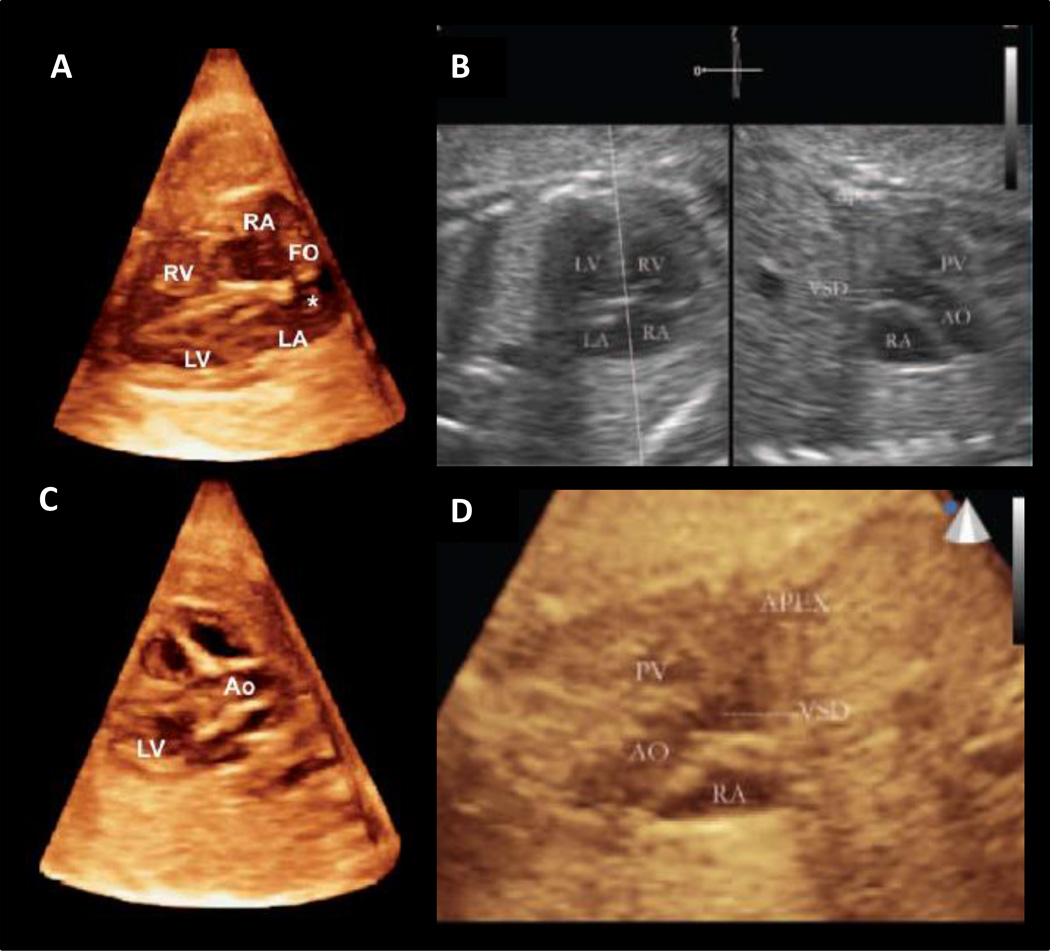
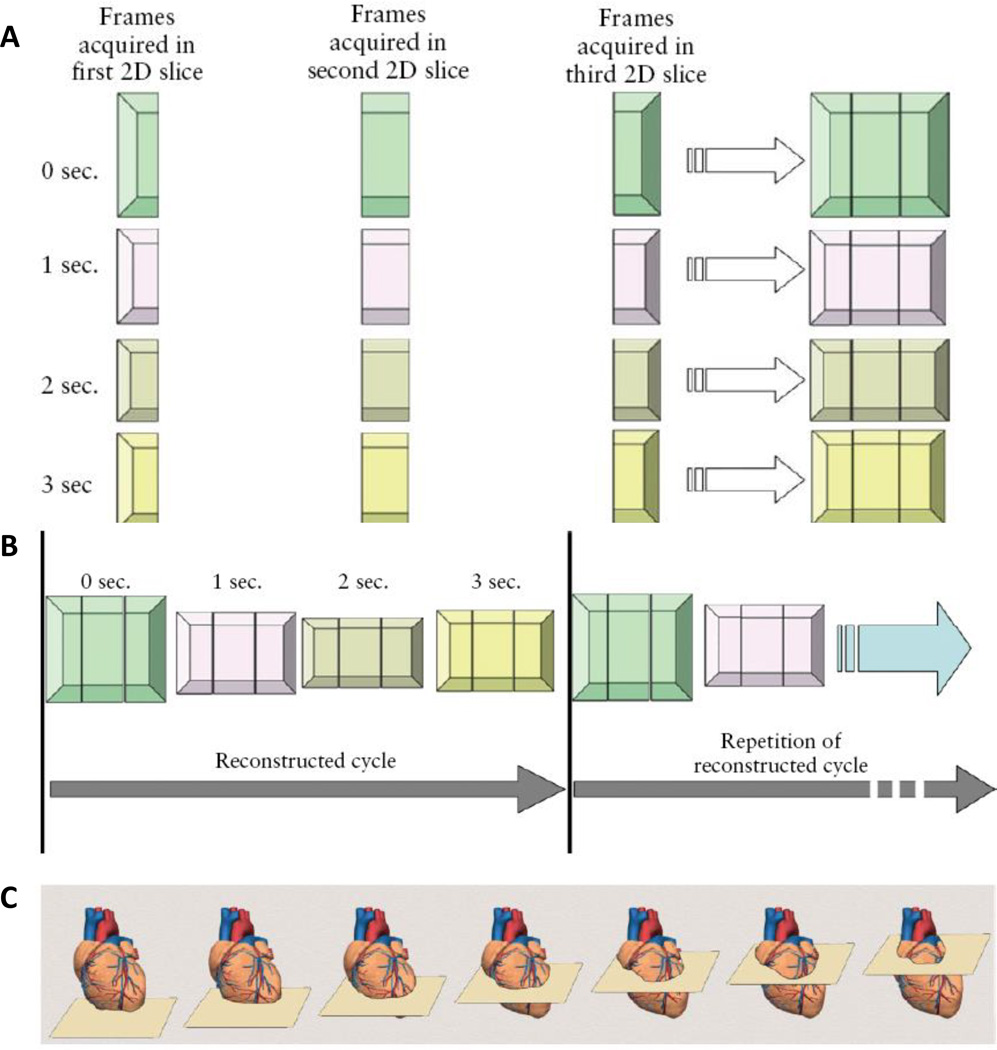
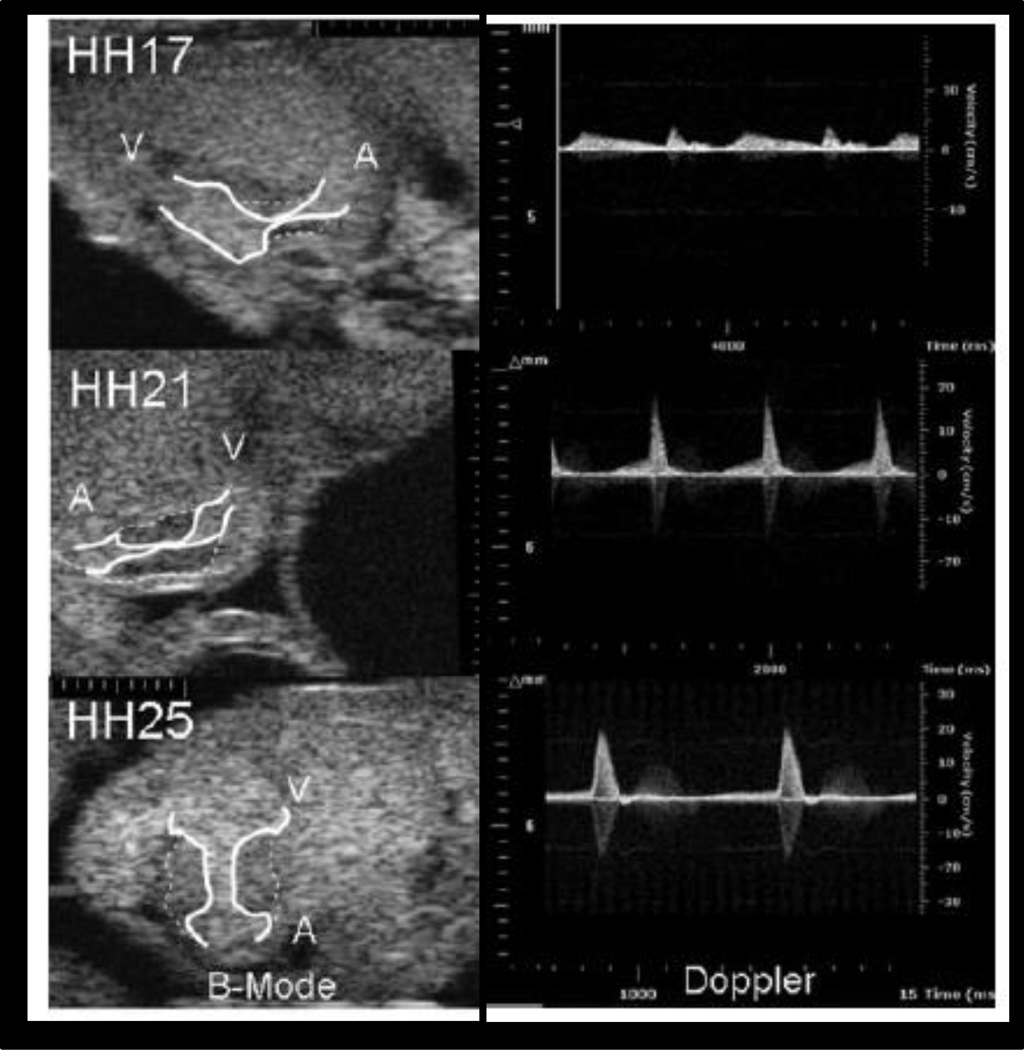
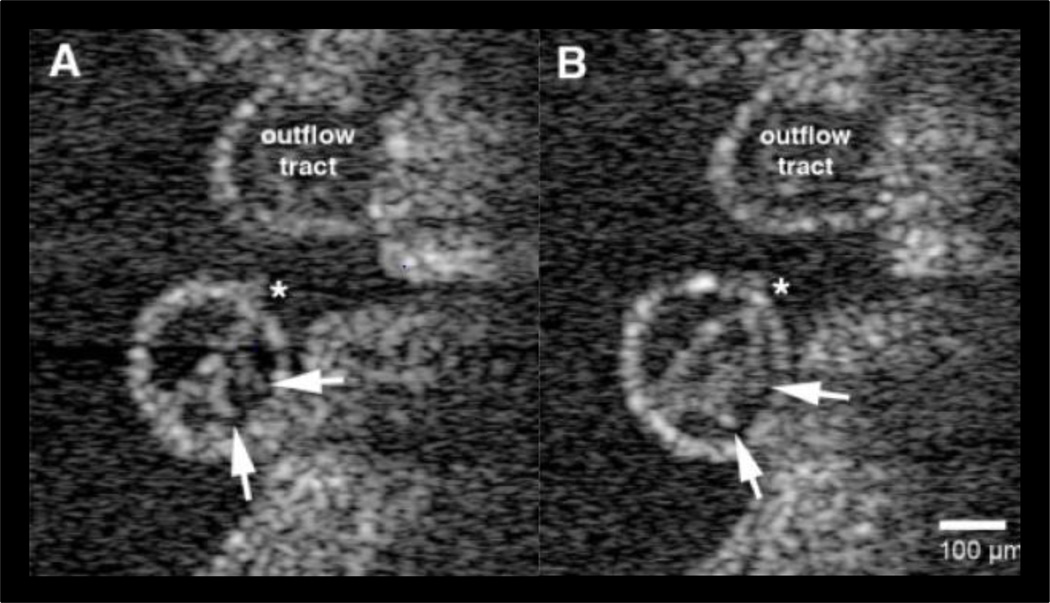
Congenital heart defects (CHD) are the most prevalent congenital disease, with 45% of deaths resulting from a congenital defect due to a cardiac malformation. Clinically significant CHD permit survival upon birth, but may become immediately life threatening. Advances in surgical intervention have significantly reduced perinatal mortality, but the outcome for many malformations is bleak. Furthermore, patients living while tolerating a CHD often acquire additional complications due to the long-term systemic blood flow changes caused by even subtle anatomical abnormalities. Accurate diagnosis of defects during fetal development is critical for interventional planning and improving patient outcomes. Advances in quantitative, multidimensional imaging are necessary to uncover the basic scientific and clinically relevant morphogenetic changes and associated hemodynamic consequences influencing normal and abnormal heart development. Ultrasound is the most widely used clinical imaging technology for assessing fetal cardiac development. Ultrasound-based fetal assessment modalities include motion mode (M-mode), two dimensional (2D), and 3D/4D imaging. These datasets can be combined with computational fluid dynamics analysis to yield quantitative, volumetric, and physiological data. Additional imaging modalities, however, are available to study basic mechanisms of cardiogenesis, including optical coherence tomography, microcomputed tomography, and magnetic resonance imaging. Each imaging technology has its advantages and disadvantages regarding resolution, depth of penetration, soft tissue contrast considerations, and cost. In this review, we analyze the current clinical and scientific imaging technologies, research studies utilizing them, and appropriate animal models reflecting clinically relevant cardiogenesis and cardiac malformations. We conclude with discussing the translational impact and future opportunities for cardiovascular development imaging research.
Keywords: MRI; OCT; cardiac development; congenital heart defect; imaging; micro-CT; ultrasound.
Copyright © 2013 Wiley Periodicals, Inc.
Figures
Similar articles
-
Phenotyping cardiac and structural birth defects in fetal and newborn mice.Birth Defects Res. 2017 Jun 1;109(10):778-790. doi: 10.1002/bdr2.1048. Epub 2017 May 22. Birth Defects Res. 2017. PMID: 28544620 Free PMC article. Review.
-
Advances in fetal cardiac imaging.Pediatr Cardiol. 2004 May-Jun;25(3):307-21. doi: 10.1007/s00246-003-0594-0. Pediatr Cardiol. 2004. PMID: 15360121 Review.
-
Imaging techniques for visualizing and phenotyping congenital heart defects in murine models.Birth Defects Res C Embryo Today. 2013 Jun;99(2):93-105. doi: 10.1002/bdrc.21037. Birth Defects Res C Embryo Today. 2013. PMID: 23897594 Free PMC article. Review.
-
A review of the complementary information available with cardiac magnetic resonance imaging and multi-slice computed tomography (CT) during the study of congenital heart disease.Int J Cardiovasc Imaging. 2004 Dec;20(6):569-78. doi: 10.1007/s10554-004-7021-3. Int J Cardiovasc Imaging. 2004. PMID: 15856644 Review.
-
Assessment of Fetal Congenital Heart Diseases by 4-Dimensional Ultrasound Using Spatiotemporal Image Correlation: Pictorial Review.Ultrasound Q. 2018 Mar;34(1):11-17. doi: 10.1097/RUQ.0000000000000328. Ultrasound Q. 2018. PMID: 29112643 Review.
Cited by
-
Comparative analysis of metallic nanoparticles as exogenous soft tissue contrast for live in vivo micro-computed tomography imaging of avian embryonic morphogenesis.Dev Dyn. 2016 Oct;245(10):1001-10. doi: 10.1002/dvdy.24433. Epub 2016 Aug 18. Dev Dyn. 2016. PMID: 27447729 Free PMC article.
-
Respiratory Effects on Fontan Circulation During Rest and Exercise Using Real-Time Cardiac Magnetic Resonance Imaging.Ann Thorac Surg. 2016 May;101(5):1818-25. doi: 10.1016/j.athoracsur.2015.11.011. Epub 2016 Feb 10. Ann Thorac Surg. 2016. PMID: 26872728 Free PMC article.
References
-
- Cardiac screening examination of the fetus: guidelines for performing the 'basic' and 'extended basic' cardiac scan. Ultrasound in Obstetrics & Gynecology. 2006;27(1):107–113. - PubMed
-
- Acar P, Dulac Y, et al. Real-time three-dimensional fetal echocardiography using matrix probe. Prenatal Diagnosis. 2005;25(5):370–375. - PubMed
-
- Adriaanse BME, Tromp CHN, et al. Interobserver agreement in detailed prenatal diagnosis of congenital heart disease by telemedicine using four-dimensional ultrasound with spatiotemporal image correlation. Ultrasound in Obstetrics & Gynecology. 2012;39(2):203–209. - PubMed
-
- Allan L. Technique of fetal echocardiography. Pediatric Cardiology. 2004;25(3):223–233. - PubMed
Publication types
MeSH terms
Grants and funding
LinkOut - more resources
Full Text Sources
Other Literature Sources
