. 2013 Oct;81(10):3825-34.
doi: 10.1128/IAI.00570-13. Epub 2013 Jul 29.

CD8+ T cells specific for a malaria cytoplasmic antigen form clusters around infected hepatocytes and are protective at the liver stage of infection

Affiliations

CD8+ T cells specific for a malaria cytoplasmic antigen form clusters around infected hepatocytes and are protective at the liver stage of infection

Kazumi Kimura et al. Infect Immun. 2013 Oct.

Abstract

Following Anopheles mosquito-mediated introduction into a human host, Plasmodium parasites infect hepatocytes and undergo intensive replication. Accumulating evidence indicates that CD8(+) T cells induced by immunization with attenuated Plasmodium sporozoites can confer sterile immunity at the liver stage of infection; however, the mechanisms underlying this protection are not clearly understood. To address this, we generated recombinant Plasmodium berghei ANKA expressing a fusion protein of an ovalbumin epitope and green fluorescent protein in the cytoplasm of the parasite. We have shown that the ovalbumin epitope is presented by infected liver cells in a manner dependent on a transporter associated with antigen processing and becomes a target of specific CD8(+) T cells from the T cell receptor transgenic mouse line OT-I, leading to protection at the liver stage of Plasmodium infection. We visualized the interaction between OT-I cells and infected hepatocytes by intravital imaging using two-photon microscopy. OT-I cells formed clusters around infected hepatocytes, leading to the elimination of the intrahepatic parasites and subsequent formation of large clusters of OT-I cells in the liver. Gamma interferon expressed in CD8(+) T cells was dispensable for this protective response. Additionally, we found that polyclonal ovalbumin-specific memory CD8(+) T cells induced by de novo immunization were able to confer sterile protection, although the threshold frequency of the protection was relatively high. These studies revealed a novel mechanism of specific CD8(+) T cell-mediated protective immunity and demonstrated that proteins expressed in the cytoplasm of Plasmodium parasites can become targets of specific CD8(+) T cells during liver-stage infection.


Figures

Fig 1
Fig 1
Expression of a model antigen in the cytoplasm of recombinant P. berghei ANKA. (A) Schematic representation of the transgenic P. berghei ANKA constructs used in this study. (B) PbA-gfpOVA sporozoites, HepG2 cells infected with PbA-gfpOVA sporozoites in vitro, and infected RBCs (iRBC) were stained with BODIPY-TR-C5-ceramide and DRAQ5, which mark membrane structure and nuclei, respectively. Images were obtained using confocal microscopy. Arrowheads, margin of the RBC. Bars, 5 μm.
Fig 2
Fig 2
OT-I cells protect against infection with sporozoites of OVA-expressing P. berghei ANKA. B6 mice were inoculated with activated OT-I CD8+ T cells (0 to 107) (A, B) and infected with sporozoites (300/mouse) of PbA-hsOVA or wild-type P. berghei ANKA (PbA) (A) or PbA-gfpOVA (B) 2 days later. (C) Alternatively, after transfer with OT-II CD4+ T cells (3 × 10⁷ or 0), mice were infected with PbA-hsOVA sporozoites (500/mouse). (A to C) Representative flow cytometry profiles of PBLs from mice to which OT-I cells (1× 10⁷) (A, B) or OT-II cells (3 × 10⁷) (C) were transferred are also shown. The proportions of OT-I or OT-II cells within the total CD8+ or CD4+ T cell populations are indicated. Note that the levels of CD8 expression on activated T cells are reduced, as reported previously (38). The number in the upper left of each graph indicates the number of transferred cells; the number in parentheses indicates the proportion of OT-I cells in the total CD8+ T cell population in PBLs at the time of infection (A and B) or the proportion of OT-II cells in the total CD4+ T cells in PBL (C). Parasitemia was monitored daily starting at 4 days after infection. Values significantly different (P < 0.05) from those for mice not receiving T cells are indicated (*). The experiments were performed twice (B, C) or 3 times (A); representative data are shown.
Fig 3
Fig 3
TAP-dependent presentation of MHC-I epitope by infected host cells. (A and B) B6 (A and B) or TAP−/− (B) mice were inoculated (or not inoculated, for controls) with activated OT-I CD8+ T cells and infected with sporozoites (5 × 10³) of PbA-hsOVA or P. berghei ANKA (PbA). (A) The numbers in parentheses indicate the proportion of OT-I cells in the total CD8+ T cell population in PBLs at the time of infection. (C) Bone marrow (BM) chimeras were generated between B6 and TAP−/− mice (as described in Materials and Methods), and the mice were inoculated with OT-I cells and infected with PbA-hsOVA sporozoites. Two days after infection, RNA was extracted from the livers of the infected mice and the parasite burden was determined by real-time PCR. The experiments were performed twice (A) or 3 times (B, C); representative data are shown. ns, not significant; *, P < 0.05; **, P < 0.01.
Fig 4
Fig 4
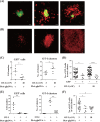
Clustering of OT-I cells around GFP+ infected hepatocytes during liver-stage infection with PbA-gfpOVA. Activated DsRed/OT-I CD8+ T cells were transferred into B6 mice at a dose of 3 × 10⁶ (A, C, D, F) or 1 × 10⁷ (B, C to F), and the mice were infected with PbA-gfpOVA sporozoites (1 × 10⁴). (E, F) Some mice did not receive DsRed/OT-I or were not infected with PbA-gfpOVA as controls. At 48 h after infection, the liver was imaged with TPM. (A, B) The 2-dimensional projections of 3-dimensional imaging volumes are shown. Bars, 10 μm. A still image of GFP+ cell disappearance while in contact with OT-I cells is shown (A, right; a time-lapse image is shown in Movie S1 in the supplemental material). (C, E) The numbers of GFP+ cells and T cell clusters within a surface area of 75 mm2 were counted using fluorescence microscopy. (D, F) GFP+ cells and T cell clusters were imaged in 3 dimensions using TPM, and the number of OT-I cells within each cluster was determined using Imaris software. (D) The number of OT-I cells was determined separately for clusters containing and not containing GFP+ cells. Bars indicate averages. *, P < 0.05; **, P < 0.01; ***, P < 0.0001.
Fig 5
Fig 5
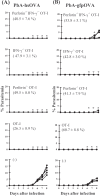
Perforin and IFN-γ expressed in CD8+ T cells are dispensable for sterile immunity at the liver stage of infection. Activated CD8+ T cells from perforin−/− IFN-γ−/− OT-I, IFN-γ−/− OT-I, perforin−/− OT-I, or wild-type OT-I mice or no cells [(−)] were adoptively transferred into B6 mice, which were then infected with sporozoites (300/mouse) of PbA-hsOVA (A) or PbA-gfpOVA (B), and the levels of parasitemia were monitored. Values significantly different (P < 0.05) from those for mice not receiving OT-I cells are indicated (*). In each graph, the number in parentheses indicates the proportion of OT-I cells in the total CD8+ T cell population in PBLs at the time of infection. The experiments were performed 3 times; representative data are shown.
Fig 6
Fig 6
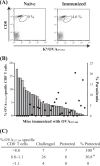
OVA-specific memory CD8+ T cells were protective against infection with PbA-hsOVA. B6 mice were immunized with OVA257-264 as described in Materials and Methods. Two months later, the proportion of OVA-specific memory CD8+ T cells was determined by staining PBLs with anti-CD8 MAb and OVA257-264/Kb tetramer. (A) Representative flow cytometry profiles of PBLs from naive and immunized mice. (B) Each bar in the graph shows the proportion of OVA-specific memory CD8+ T cells in the total CD8+ T cells for an individual mouse (left axis). The data are arranged from left to right in order of high to low specific CD8+ T cell ratios. These mice were challenged by intravenous injection of PbA-hsOVA sporozoites (1,000/mouse). Parasitemia was assessed 8 days after challenge; each dot shows the level of parasitemia in an individual mouse (right axis). (C) Data from 37 mice are summarized. *, P < 0.05%. The experiments were performed 3 times; pooled data are shown.

Similar articles

Cited by

References

    1. Nussenzweig RS, Vanderberg J, Most H, Orton C. 1967. Protective immunity produced by the injection of X-irradiated sporozoites of Plasmodium berghei. Nature 216:160–162 - PubMed
    1. Hoffman SL, Doolan DL. 2000. Malaria vaccines-targeting infected hepatocytes. Nat. Med. 6:1218–1219 - PubMed
    1. Overstreet MG, Cockburn IA, Chen YC, Zavala F. 2008. Protective CD8 T cells against Plasmodium liver stages: immunobiology of an ‘unnatural' immune response. Immunol. Rev. 225:272–283 - PMC - PubMed
    1. Mueller AK, Labaied M, Kappe SH, Matuschewski K. 2005. Genetically modified Plasmodium parasites as a protective experimental malaria vaccine. Nature 433:164–167 - PubMed
    1. Butler NS, Schmidt NW, Vaughan AM, Aly AS, Kappe SH, Harty JT. 2011. Superior antimalarial immunity after vaccination with late liver stage-arresting genetically attenuated parasites. Cell Host Microbe 9:451–462 - PMC - PubMed

Publication types

LinkOut - more resources