

Helicobacter pylori infection in a pig model is dominated by Th1 and cytotoxic CD8+ T cell responses
- PMID: 23897614
- PMCID: PMC3811743
- DOI: 10.1128/IAI.00660-13
Helicobacter pylori infection in a pig model is dominated by Th1 and cytotoxic CD8+ T cell responses
Abstract
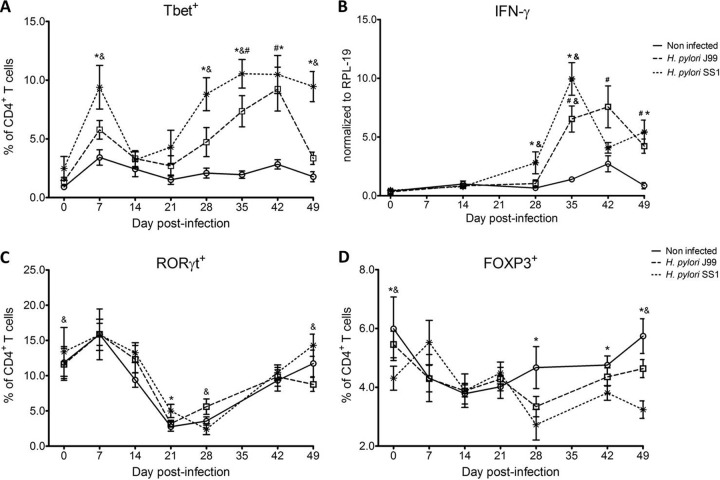
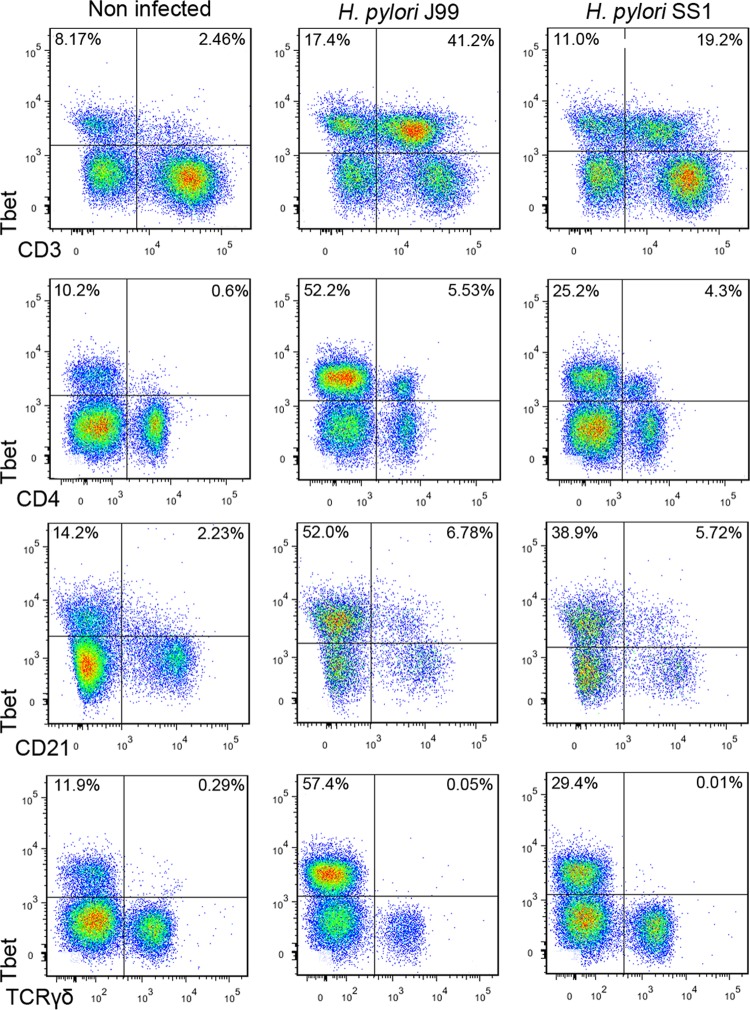
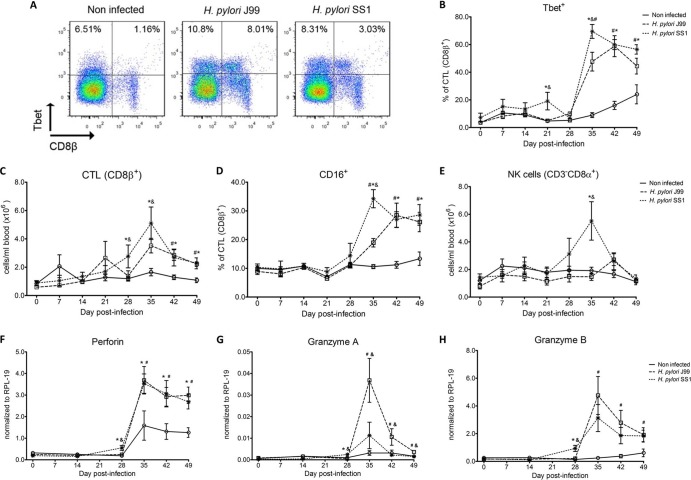
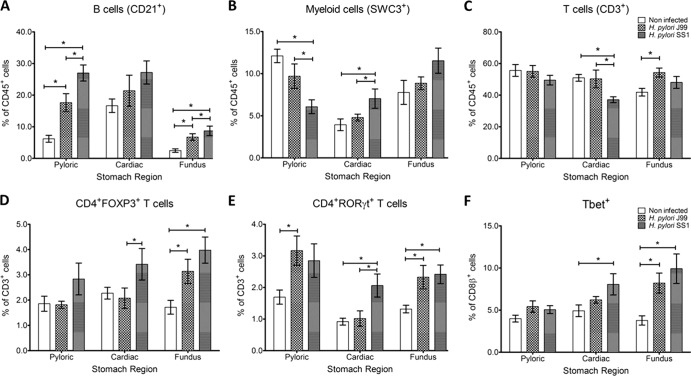
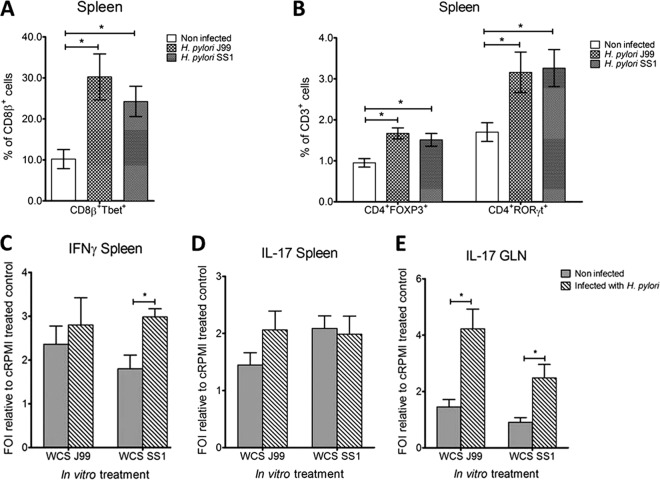
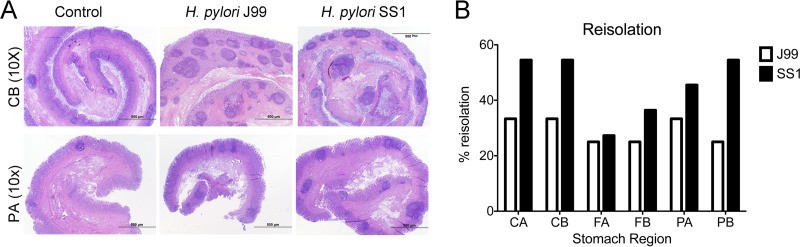
Helicobacter pylori infection is the leading cause for peptic ulcer disease and gastric adenocarcinoma. Mucosal T cell responses play an important role in mediating H. pylori-related gastric immunopathology. While induced regulatory T (iTreg) cells are required for chronic colonization without disease, T helper 1 (Th1) effector responses are associated with lower bacterial loads at the expense of gastric pathology. Pigs were inoculated with either H. pylori strain SS1 or J99. Phenotypic and functional changes in peripheral blood mononuclear cell (PBMC) populations were monitored weekly, and mucosal immune responses and bacterial loads were assessed up to 2 months postinfection. Both H. pylori strains elicited a Th1 response characterized by increased percentages of CD4(+)Tbet(+) cells and elevated gamma interferon (IFN-γ) mRNA in PBMCs. A subset of CD8(+) T cells expressing Tbet and CD16 increased following infection. Moreover, a significant increase in perforin and granzyme mRNA expression was observed in PBMCs of infected pigs, indicating a predominant cytotoxic immune response. Infiltration of B cells, myeloid cells, T cells expressing Treg- and Th17-associated transcription factors, and cytotoxic T cells was found in the gastric lamina propria of both infected groups. Interestingly, based on bacterial reisolation data, strain SS1 showed greater capacity to colonize and/or persist in the gastric mucosa than did strain J99. This novel pig model of infection closely mimics human gastric pathology and presents a suitable avenue for studying effector and regulatory responses toward H. pylori described in humans.
Figures
Similar articles
-
Predictive computational modeling of the mucosal immune responses during Helicobacter pylori infection.PLoS One. 2013 Sep 5;8(9):e73365. doi: 10.1371/journal.pone.0073365. eCollection 2013. PLoS One. 2013. PMID: 24039925 Free PMC article.
-
Helicobacter pylori infection associates with a mucosal downregulation of ghrelin, negative regulator of Th1-cell responses.Helicobacter. 2013 Dec;18(6):406-12. doi: 10.1111/hel.12065. Epub 2013 Jul 19. Helicobacter. 2013. PMID: 23865468
-
TLR2 mediates Helicobacter pylori-induced tolerogenic immune response in mice.PLoS One. 2013 Sep 13;8(9):e74595. doi: 10.1371/journal.pone.0074595. eCollection 2013. PLoS One. 2013. PMID: 24058595 Free PMC article.
-
The role of T helper 1-cell response in Helicobacter pylori-infection.Microb Pathog. 2018 Oct;123:1-8. doi: 10.1016/j.micpath.2018.06.033. Epub 2018 Jun 21. Microb Pathog. 2018. PMID: 29936093 Review.
-
Novel insights on the role of CD8+ T cells and cytotoxic responses during Helicobacter pylori infection.Gut Microbes. 2014 May-Jun;5(3):357-62. doi: 10.4161/gmic.28899. Epub 2014 Apr 22. Gut Microbes. 2014. PMID: 24755940 Free PMC article. Review.
Cited by
-
Helicobacter pylori Outer Membrane Protein 18 (Hp1125) Is Involved in Persistent Colonization by Evading Interferon- γ Signaling.Biomed Res Int. 2015;2015:571280. doi: 10.1155/2015/571280. Epub 2015 Apr 6. Biomed Res Int. 2015. PMID: 25945338 Free PMC article.
-
Mucosal Immunity Related to CD8+ T Lymphocytes in Children with Helicobacter pylori Gastritis.Pediatr Gastroenterol Hepatol Nutr. 2024 Jan;27(1):26-36. doi: 10.5223/pghn.2024.27.1.26. Epub 2024 Jan 9. Pediatr Gastroenterol Hepatol Nutr. 2024. PMID: 38249639 Free PMC article.
-
Helicobacter pylori-induced gastric pathology: insights from in vivo and ex vivo models.Dis Model Mech. 2017 Feb 1;10(2):89-104. doi: 10.1242/dmm.027649. Dis Model Mech. 2017. PMID: 28151409 Free PMC article. Review.
-
Pathogenicity of Helicobacter pylori in cancer development and impacts of vaccination.Gastric Cancer. 2019 Jan;22(1):23-36. doi: 10.1007/s10120-018-0867-1. Epub 2018 Aug 25. Gastric Cancer. 2019. PMID: 30145749 Review.
-
Exploratory study of oral mucosal colonization of human gastric Helicobacter pylori in mice.Int J Clin Exp Med. 2014 Mar 15;7(3):523-9. eCollection 2014. Int J Clin Exp Med. 2014. PMID: 24753744 Free PMC article.
References
-
- Cave DR. 1997. How is Helicobacter pylori transmitted? Gastroenterology 113:S9–S14 - PubMed
-
- Peek RM, Jr, Blaser MJ. 2002. Helicobacter pylori and gastrointestinal tract adenocarcinomas. Nat. Rev. Cancer 2:28–37 - PubMed
-
- Blaser MJ. 2008. Disappearing microbiota: Helicobacter pylori protection against esophageal adenocarcinoma. Cancer Prev. Res. (Phila.) 1:308–311 - PubMed
-
- Vieth M, Masoud B, Meining A, Stolte M. 2000. Helicobacter pylori infection: protection against Barrett's mucosa and neoplasia? Digestion 62:225–231 - PubMed
Publication types
MeSH terms
Grants and funding
LinkOut - more resources
Full Text Sources
Other Literature Sources
Medical
Research Materials
