. 2013 Nov;15(11):1502-17.
doi: 10.1093/neuonc/not104. Epub 2013 Jul 28.

Temozolomide downregulates P-glycoprotein expression in glioblastoma stem cells by interfering with the Wnt3a/glycogen synthase-3 kinase/β-catenin pathway

Affiliations

Temozolomide downregulates P-glycoprotein expression in glioblastoma stem cells by interfering with the Wnt3a/glycogen synthase-3 kinase/β-catenin pathway

Chiara Riganti et al. Neuro Oncol. 2013 Nov.

Abstract

Background: Glioblastoma multiforme stem cells display a highly chemoresistant phenotype, whose molecular basis is poorly known. We aim to clarify this issue and to investigate the effects of temozolomide on chemoresistant stem cells.

Methods: A panel of human glioblastoma cultures, grown as stem cells (neurospheres) and adherent cells, was used.

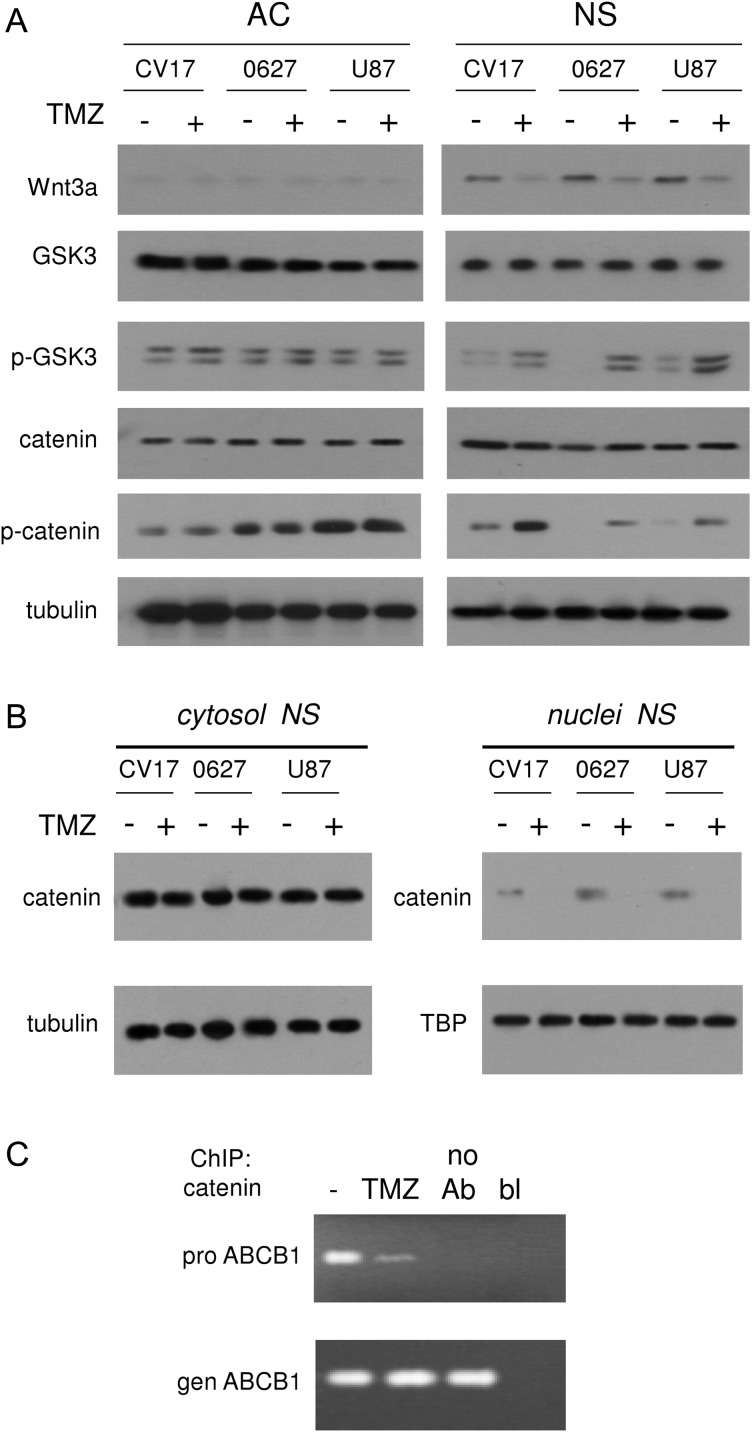
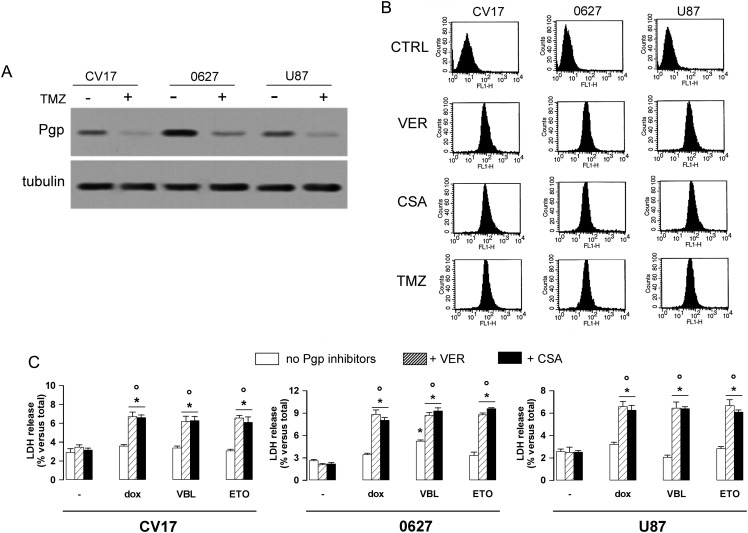
Results: Neurospheres had a multidrug resistant phenotype compared with adherent cells. Such chemoresistance was overcome by apparently noncytotoxic doses of temozolomide, which chemosensitized glioblastoma cells to doxorubicin, vinblastine, and etoposide. This effect was selective for P-glycoprotein (Pgp) substrates and for stem cells, leading to an investigation of whether there was a correlation between the expression of Pgp and the activity of typical stemness pathways. We found that Wnt3a and ABCB1, which encodes for Pgp, were both highly expressed in glioblastoma stem cells and reduced by temozolomide. Temozolomide-treated cells had increased methylation of the cytosine-phosphate-guanine islands in the Wnt3a gene promoter, decreased expression of Wnt3a, disrupted glycogen synthase-3 kinase/β-catenin axis, reduced transcriptional activation of ABCB1, and a lower amount and activity of Pgp. Wnt3a overexpression was sufficient to transform adherent cells into neurospheres and to simultaneously increase proliferation and ABCB1 expression. On the contrary, glioblastoma stem cells silenced for Wnt3a lost the ability to form neurospheres and reduced at the same time the proliferation rate and ABCB1 levels.

Conclusions: Our work suggests that Wnt3a is an autocrine mediator of stemness, proliferation, and chemoresistance in human glioblastoma and that temozolomide may chemosensitize the stem cell population by downregulating Wnt3a signaling.

Keywords: ABCB1/P-glycoprotein; Wnt3a; glioblastoma stem cells; temozolomide.


Figures

Fig. 1.
Fig. 1.
Characterization of GBM NS cells and ACs. (A) Morphologic analysis of CV17, 010627, and U87MG GBM cells, cultured as NSs or ACs and analyzed by a bright field microscope. Magnification: 100 × objective (0.52 numerical aperture); 10 × ocular lens. Bar: 20 μM. (B) Clonogenic assay. NSs or ACs were seeded at a density of 100 cells/well; the spheres or adherent colonies were counted at days 14, 28, and 42. Data are presented as means ± SD (n = 6). Significance of NS vs AC: *P < .01. (C) Self-renewal assay. NSs or ACs were diluted and seeded at a density of 1 cell/well; cells were counted at days 14, 28, and 42. Data are presented as means ± SD (n = 10). Since ACs had a value of 1 cell ± 0 at each time point, statistical analysis was not performed. (D) Cell cycle analysis. The distribution of NSs or ACs in sub-G1, G0/G1, S, and G2/M phases was analyzed by flow cytometry, as detailed under Materials and Methods. Data are presented as means ± SD (n = 4). Significance of NS vs AC: *P < .05.
Fig. 2.
Fig. 2.
Effects of TMZ and doxorubicin on GBM cells. (A–C) Drug-induced cell damage. NSs (open columns) and ACs (hatched columns) were incubated for 72 h with fresh medium (−) or TMZ at 50, 100, and 200 μM (T; panel A), 5 μM doxorubicin for 24 h (dox; panel B), or 50 μM TMZ for 72 h plus 5 μM doxorubicin for the last 24 h (panel C). Human doxorubicin-sensitive colon cancer HT29 cells and the doxorubicin-resistant counterpart HT29-dx cells were used in (B) as positive controls of drug-sensitive and drug-resistant cells, respectively. The culture medium was collected and analyzed in duplicate for the LDH release, as an index of cytotoxicity. Data are presented as means ± SD (n = 4). Significance vs untreated (−) cells: *P < .02; T + dox vs T alone: °P < .05. (D) NSs were seeded at a concentration of 100 cells/well, left untreated (ctrl) or treated at days 4, 11, 18, 25, 32, and 39 with 50 μM TMZ (T) for 72 h, 5 μM doxorubicin for 24 h, or TMZ for 72 h with the addition of doxorubicin in the last 24 h. At the end of each treatment, cells were washed and reseeded in fresh medium. The spheres formed in each well were counted at days 14, 28, and 42. Data are presented as means ± SD (n = 4). Significance vs untreated cells: *P < .02; T + dox vs T alone: °P < .005. (E) NSs incubated as reported in (C) were subjected to cell cycle analysis. Data are presented as means ± SD (n = 3). Significance vs untreated (−) cells: *P < .01; T + dox vs T alone: °P < .02.
Fig. 3.
Fig. 3.
Effects of TMZ, vinblastine, and etoposide on NS GBM cells. (A) Drug-induced cell damage. NSs were incubated with fresh medium (−) or 50 μM TMZ for 72 h (T), 20nM vinblastine for 24 h (VBL), 10 μM etoposide for 24 h (ETO), or 50 μM TMZ for 72 h with the addition of vinblastine or etoposide in the last 24 h. The culture medium was collected and analyzed in duplicate for the LDH release as an index of cytotoxicity. Data are presented as means ± SD (n = 3). Significance vs untreated (−) cells: *P < .05; T + VBL/ETO vs T alone: °P < .05. (B) NSs were seeded in the plate at a concentration of 100 cells/well and left untreated (ctrl) or treated at days 4, 11, 18, 25, 32, and 39 with 50 μM TMZ (T) for 72 h, 20nM vinblastine for 24 h (VBL), 10 μM etoposide for 24 h (ETO), or 50 μM TMZ for 72 h plus vinblastine or etoposide in the last 24 h. At the end of each treatment, cells were washed and reseeded in fresh medium. The spheres formed in each well were counted at days 14, 28, and 42. Data are presented as means ± SD (n = 4). Significance vs untreated cells: *P < .05; T + VBL/ETO vs T alone: °P < .001. (C) NSs incubated as reported in (A) were subjected to cell cycle analysis. Data are presented as means ± SD (n = 3). Significance vs untreated (−) cells: *P < .05; T + dox vs T alone: °P < .05.
Fig. 4.
Fig. 4.
Expression levels of Wnts and ABCB1 genes in GBM cells. CV17, 010627, and U87MG GBM cells, cultured as ACs (open columns) or NSs (hatched columns), were subjected to RNA extraction and qRT-PCR to measure the expression of Wnt3a, Wnt5 (Wn, panel A), and ABCB1 (panel B). The expression level of CV17 ACs was considered “1” and used as the reference for all the other experimental conditions. Data are presented as means ± SD (n = 3). Versus ctrl: *P < .05. (C) Time-dependent expression of Wnt3a and ABCB1 genes in CV17, 010627, and U87MG NSs, incubated in the absence (−) or presence of 50 μM TMZ (T) for 24, 48, and 72 h. The expression level of CV17 cells was considered “1” and used as the reference for all the other experimental conditions. Data are presented as means ± SD (n = 3). Versus ctrl: *P < .05. (D) Methylation of Wnt3a promoter. Genomic DNA from CV17, 010627, U87MG, and No3 NSs, incubated in fresh medium (−) or with 50 μM TMZ (T) for 48 h was subjected to bisulfite modification, followed by PCR with specific primers for methylated (M) and unmethylated (UM) Wnt3a promoter. The figure is representative of 3 experiments with similar results. + : positive controls with a universally methylated or unmethylated genome sequence. bl: blank.
Fig. 5.
Fig. 5.
Effects of Wnt3a overexpression and silencing on morphology and proliferation in 010627 GBM cells. (A) 010627 ACs (gray peak) were transfected with a pCMV6-AC-GFP empty vector (dotted line) or with Wnt3a-pCMV6-AC-GFP expression vector (Wnt3a+; continuous line). NS 010627 cells (gray peak) were transfected with a 29-mer scrambled shRNA pGFP-V-RS vector (dotted line) or with a pGFP-V-RS shRNA-Wnt3a vector (Wnt3a; continuous line). The efficiency of transfection was checked by flow cytometry after 24 h. The figures shown here are representative of 3 similar experiments, each performed in triplicate. (B) Wnt3a expression was detected 48 h after the transfection in triplicate by qRT-PCR. The expression level of 010627 ACs was considered “1” and used as the reference for all the other experimental conditions. Data are presented as means ± SD (n = 3). Versus 010627 AC ctrl: *P < .02; vs 010627 NS ctrl: °P < .001. (C) Microscope analysis of Wnt3a-overexpressing 010627 ACs (010627 AC Wnt3a+) and of Wnt3a-silenced 010627 NSs (010627 NS Wnt3a). The samples were analyzed by Nomarski differential interference contrast optics (DIC; left panel) or by FV300 laser scanning confocal microscope for GFP signal (right panel). The micrographs are representative of the cell morphology 72 h after transfection. Magnification: 60 × objective (1.4 numerical aperture); 10 × ocular lens. (D) Cell proliferation was measured in triplicate 96 h after transfection by the [3H]thymidine incorporation assay. Data are presented as means ± SD (n = 3). Versus 010627 AC ctrl: *P < .001; vs 010627 NS ctrl: °P < .001. (E) Clonogenic assay. Wild-type 010627 ACs (ctrl), 010627 ACs transfected with a pCMV6-AC-GFP empty vector (empty), AC 010627 cells stably overexpressing Wnt3a (Wnt3a+), wild-type NS 010627 cells (ctrl), NS 010627 transfected with a 29-mer scrambled shRNA pGFP-V-RS vector (scrambled), 010627 NSs stably silenced for Wnt3a (Wnt3a) were seeded at a density of 100 cells/well; the spheres or adherent colonies were counted at days 14, 28, and 48. Data are presented as means ± SD (n = 4). Significance of Wnt3a+ or Wnt3a vs the respective ctrl: *P < .002. (C) Self-renewal assay. NSs or ACs were diluted and seeded at a density of 1 cell/well; cells were counted at days 14, 28, and 48. Data are presented as means ± SD (n = 10). Since wild-type 010627 ACs and 010627 ACs transfected with the empty vector had a value of 1 cell ± 0 at each time point, statistical analysis was not performed.
Fig. 6.
Fig. 6.
Effects of Wnt3a overexpression and silencing on the GSK3/β-catenin pathway and ABCB1 expression in 010627 GBM cells. 010627 ACs were transfected with a pCMV6-AC-GFP empty vector (empty) or with Wnt3a-pCMV6-AC-GFP expression vector (Wnt3a+). 010627 NSs were transfected with a 29-mer scrambled shRNA pGFP-V-RS vector (scrambled) or with a pGFP-V-RS shRNA-Wnt3a vector (Wnt3a). (A) Western blot analysis (96 h after the transfection) of GSK3, phospho(Tyr216)GSK3 (p-GSK3), β-catenin, and phospho(Ser33/37/Thr41)β-catenin (p-catenin) in whole cell lysates. Tubulin expression was used as control of equal protein loading. The figure is representative of 3 experiments with similar results. (B) ABCB1 expression was detected in triplicate by qRT-PCR 96 h after the transfection. The expression level of 010627 AC was considered “1” and used as reference for all the other experimental conditions. Data are presented as means ± SD (n = 3). Versus 010627 AC ctrl: *P < .01; vs 010627 NS ctrl: °P < .001.
Fig. 7.
Fig. 7.
Effects of TMZ on Wnt3a/GSK3/β-catenin/Pgp axis in GBM cells. CV17, 010627, and U87MG GBM cells, cultured as ACs or NSs, were incubated for 48 h in the absence (−) or presence (+) of 50 μM TMZ. (A) Western blot analysis of Wnt3a, GSK3, phospho(Tyr216)GSK3 (p-GSK3), β-catenin, and phospho(Ser33/37/Thr41)β-catenin (p-catenin) in whole cell lysates. Tubulin expression was used as control of equal protein loading. The figure is representative of 3 experiments with similar results. (B) Nuclear and cytosolic extracts prepared from NSs were analyzed for the amount of β-catenin. The expressions of tubulin and TBP (TATA-box binding protein) were used as control of equal protein loading for cytosolic and nuclear samples, respectively. The figure is representative of 2 experiments with similar results. (C) ChIP of β-catenin on ABCB1 promoter in 010627 NS cells. no Ab: precipitated samples without anti–β-catenin antibody. bl: blank. The figure is representative of 3 experiments with similar results.
Fig. 8.
Fig. 8.
Effects of TMZ on Pgp expression and activity in GBM cells. (A) CV17, 010627, and U87MG GBM cells, cultured as NSs, were incubated for 72 h in the absence (−) or presence (+) of 50 μM TMZ. Cells were lysed and subjected to Western blot for Pgp protein. Tubulin expression was used as control of equal protein loading. The figure is representative of 2 experiments with similar results. (B) NSs were grown in fresh medium (CTRL), with 10 μM verapamil (VER) or cyclosporine A (CSA) for 24 h, or 50 μM TMZ for 72 h, then incubated with the Pgp substrate rhodamine 123. The activity of Pgp, measured as the rate of efflux of rhodamine, was evaluated by flow cytometry (see Materials and Methods). The figures shown here are representative of 3 similar experiments, performed in duplicate. (C) NSs were incubated for 24 h in fresh medium (−) or in the presence of 5 μM doxorubicin (dox), 20nM vinblastine (VBL), or 10 μM etoposide (ETO), alone (no Pgp inhibitors) or together with 10 μM verapamil or 10 μM cyclosporine A. The culture medium was collected and analyzed in duplicate for LDH release, as an index of cytotoxicity. Data are presented as means ± SD (n = 3). Significance vs untreated (−) cells: *P < .01; dox/VBL/ETO + VER or CSA vs dox/VBL/ETO alone: °P < .01.

Similar articles

Cited by

References

    1. Adamson C, Kanu OO, Mehta AI, et al. GBM multiforme: a review of where we have been and where we are going. Expert Opin Investig Drugs. 2009;18:1061–1083. - PubMed
    1. Bai RY, Staedke V, Riggins GJ. Molecular targeting of GBM: drug discovery and therapies. Trends Mol Med. 2011;17:301–312. - PMC - PubMed
    1. Beier D, Schulz JB, Beier CP. Chemoresistance of glioblastoma cancer stem cells—much more complex than expected. Mol Cancer. 2011;10:128. - PMC - PubMed
    1. Gong X, Schwartz PH, Linskey ME, Bota DA. Neural stem/progenitors and glioma stem-like cells have differential sensitivity to chemotherapy. Neurology. 2011;76:1126–1113. - PMC - PubMed
    1. Yamada R, Nakano I. Glioma stem cells: their role in chemoresistance. World Neurosurg. 2012;77:237–240. - PubMed

Publication types

MeSH terms