

Review
doi: 10.1002/wsbm.1238.
Epub 2013 Jul 29.
Computational approaches for understanding energy metabolism
Affiliations
- PMID: 23897661
- PMCID: PMC3906216
- DOI: 10.1002/wsbm.1238
Item in Clipboard
Review
Computational approaches for understanding energy metabolism
Wiley Interdiscip Rev Syst Biol Med.
2013 Nov-Dec.
Abstract
There has been a surge of interest in understanding the regulation of metabolic networks involved in disease in recent years. Quantitative models are increasingly being used to interrogate the metabolic pathways that are contained within this complex disease biology. At the core of this effort is the mathematical modeling of central carbon metabolism involving glycolysis and the citric acid cycle (referred to as energy metabolism). Here, we discuss several approaches used to quantitatively model metabolic pathways relating to energy metabolism and discuss their formalisms, successes, and limitations.
Copyright © 2013 Wiley Periodicals, Inc.
Figures

Constant constraints on the Vi limit the feasible solution to an n-dimensional cube (shown in gray). Further linear constraints from the S matrix create a cone of feasible solutions (blue). Linear programming algorithms find an optimal solution on a vertex (illustrated with orange circle). (B and C) Depiction of a simple metabolic network with compartmentalization and its associated stoichiometric matrix. The three compartments, denoted with subscripts b, e, and c represent the boundary, extracellular environment, and cytosol. The boundary is what separates the model from its environment, and mass balance is not assumed at the boundary; this allows for the implementation of source and sink reactions.
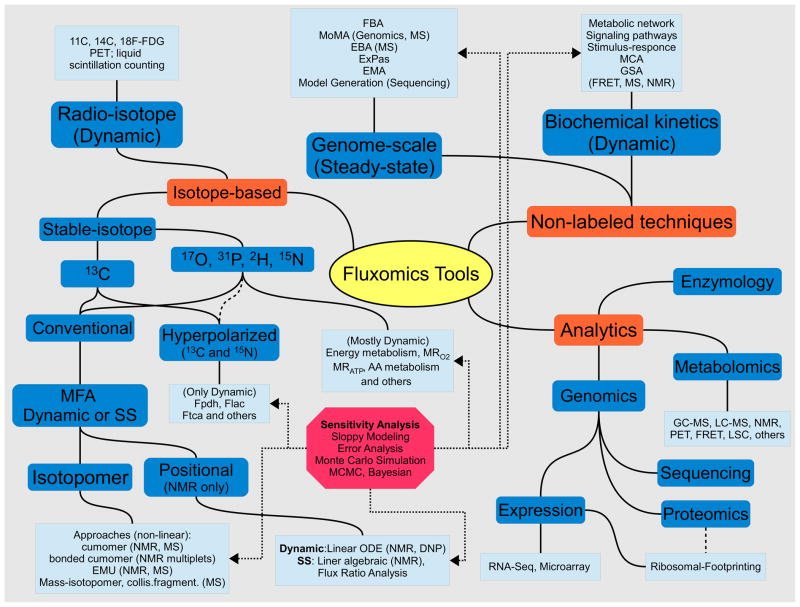
Important to fluxomics are both the mathematical and computational tools for non-labeled and labeled techniques, as well as the analytical methods used to obtain data and parameters. Metabolite concentrations and kinetic parameters are obtained primarily from both Gas Chromatography and Liquid Chromatography Mass-Spectrometry (GC-MS and LC-MS), Nuclear Magnetic Resonance (NMR), UV-V is spectroscopy, electrochemistry, Förster (Fluorescence) resonance energy transfer (FRET), Positron Emission Tomography (PET), Liquid Scintillation Counting (LSC), and classical enzymology. Sequence data is employed in the construction of organism models, whereas proteomics and expression data find use in the creation of tissue or cell-type specific models. High-quality expression data such as RNA-Seq and Ribosomal Footprinting are beginning to find uses in flux prediction. Several prominent genome-scale techniques include Flux Balance Analysis (FBA), Minimization of Metabolic Adjustment (MoMA), Energy Balance Analysis (EBA), ExPas (Extreme Pathways), and Elementary Mode Analysis (EMA). Isotope-based approaches include stable isotope techniques (mostly convenient 13C MFA and other nuclei, namely 17O, 31P, 2H and 15N used to study central metabolism), hyperpolarized 13C (Dynamic Nuclear Polarization (DNP)) and radio-isotopes which are studied with PET and LSC. Well-established MFA tools include isotopomer and positional modeling which could be studied dynamically or at steady-state (SS). With hyperpolarized technique it is possible to extract energy-related fluxes like Pyruvate dehydrogenase flux Fpdh, Lactate production rate Flac and Tricarboxylic Acid Flux Ftca (e.g. with [1- or 2-13C]Pyr as tracers). With other nuclei, the metabolic rate of Oxygen consumption MRO2 and ATP production MRATP and Amino Acids fluxes (AA) could be accessed directly. Advanced isotopomer techniques include cumomer approach with Elementary Metabolite Units (EMU) and Bonded Cumomers frameworks designed to reduce the number of independent variables while retaining all measurable isotopomer information. Non-labeled techniques along with genome-scale analysis include biochemical kinetics modeling tools to study metabolic and signaling networks and their regulation architecture with established tools like Metabolic Control Analysis (MCA) and Global Sensitivity Analysis (GSA). Additional sensitivity analysis should be conducted e.g. with Monte-Carlo techniques like Markov Chain Monte-Carlo (MCMC, Bayesian) analysis to check the reliability of extracted metabolic parameters, including fluxes.
Similar articles
-
Catabolite regulation analysis of Escherichia coli for acetate overflow mechanism and co-consumption of multiple sugars based on systems biology approach using computer simulation.J Biotechnol. 2013 Oct 20;168(2):155-73. doi: 10.1016/j.jbiotec.2013.06.023. Epub 2013 Jul 10. J Biotechnol. 2013. PMID: 23850830
-
Plant metabolic modeling: achieving new insight into metabolism and metabolic engineering.Plant Cell. 2014 Oct;26(10):3847-66. doi: 10.1105/tpc.114.130328. Epub 2014 Oct 24. Plant Cell. 2014. PMID: 25344492 Free PMC article. Review.
-
Quantitative, scalable discrete-event simulation of metabolic pathways.Proc Int Conf Intell Syst Mol Biol. 1999:187-94. Proc Int Conf Intell Syst Mol Biol. 1999. PMID: 10786301
-
Mathematical formalisms based on approximated kinetic representations for modeling genetic and metabolic pathways.Biotechnol Genet Eng Rev. 2008;25:1-40. doi: 10.5661/bger-25-1. Biotechnol Genet Eng Rev. 2008. PMID: 21412348 Review.
-
Computational modeling in systems biology.Methods Mol Biol. 2010;662:97-120. doi: 10.1007/978-1-60761-800-3_5. Methods Mol Biol. 2010. PMID: 20824468 Review.
Cited by
-
Multi-scale computational study of the Warburg effect, reverse Warburg effect and glutamine addiction in solid tumors.PLoS Comput Biol. 2018 Dec 7;14(12):e1006584. doi: 10.1371/journal.pcbi.1006584. eCollection 2018 Dec. PLoS Comput Biol. 2018. PMID: 30532226 Free PMC article.
-
Understanding metabolism with flux analysis: From theory to application.Metab Eng. 2017 Sep;43(Pt B):94-102. doi: 10.1016/j.ymben.2016.09.005. Epub 2016 Sep 22. Metab Eng. 2017. PMID: 27667771 Free PMC article. Review.
-
Systems biology of host-microbe metabolomics.Wiley Interdiscip Rev Syst Biol Med. 2015 Jul-Aug;7(4):195-219. doi: 10.1002/wsbm.1301. Epub 2015 Apr 30. Wiley Interdiscip Rev Syst Biol Med. 2015. PMID: 25929487 Free PMC article. Review.
-
A Flux Balance of Glucose Metabolism Clarifies the Requirements of the Warburg Effect.Biophys J. 2016 Sep 6;111(5):1088-100. doi: 10.1016/j.bpj.2016.07.028. Biophys J. 2016. PMID: 27602736 Free PMC article.
-
Mitochondrial Respiration Chain Enzymatic Activities in the Human Brain: Methodological Implications for Tissue Sampling and Storage.Neurochem Res. 2016 Apr;41(4):880-91. doi: 10.1007/s11064-015-1769-9. Epub 2015 Nov 19. Neurochem Res. 2016. PMID: 26586405
References
-
- Shapiro HM. Studies in the Structure of the Bacterial Economy: An Input-Output Model of Escherichia Coli. 1961
-
- Shapiro HM. Input-Output Models of Biological Systems: Formulation and Applicability. Computers and Biomedical Research. 1969;2:430–445. - PubMed
-
- Panne, Van De C, Rahnamat F. The First Algorithm for Linear Programming_: An Analysis of Kantorovich’s Method. Economics of Planning. 1985;19:76–91.
-
- Watson MR. Metabolic maps for the Apple II. Biochemical Society Transactions. 1984;12:1093–1094.
-
- Savinell JM, Palsson BØ. Network analysis of intermediary metabolism using linear optimization. I. Development of mathematical formalism. Journal of theoretical biology. 1992;154:421–54. - PubMed
Publication types
MeSH terms
Grants and funding
LinkOut - more resources
Full Text Sources
Other Literature Sources
