Review
. 2013 Jul;3(3):1079-123.
doi: 10.1002/cphy.c110061.

Proximal nephron

Affiliations
Review

Proximal nephron

Jia L Zhuo et al. Compr Physiol. 2013 Jul.

Abstract

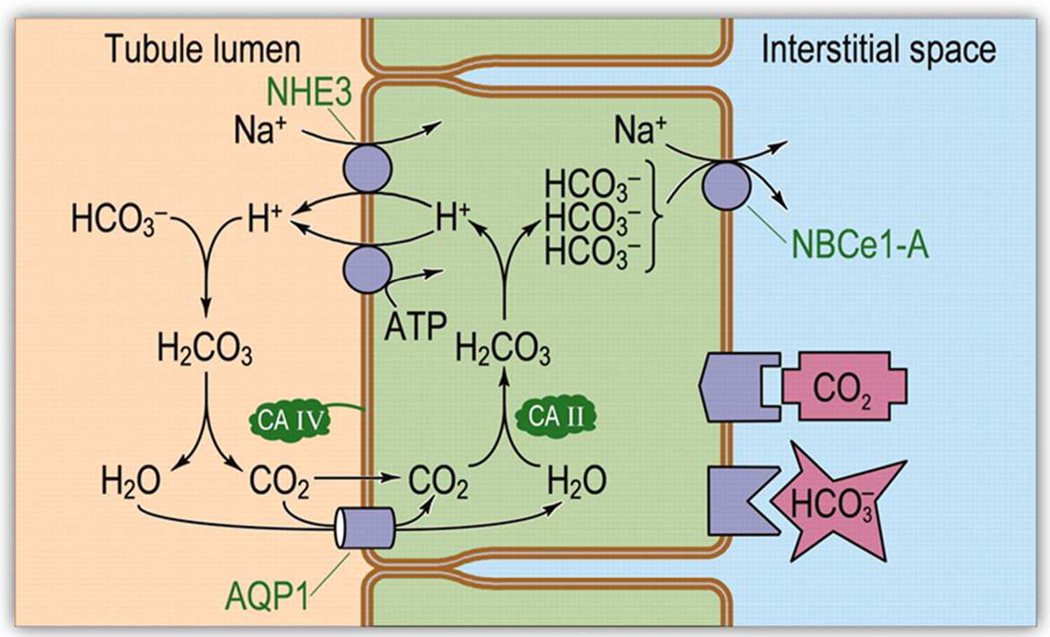
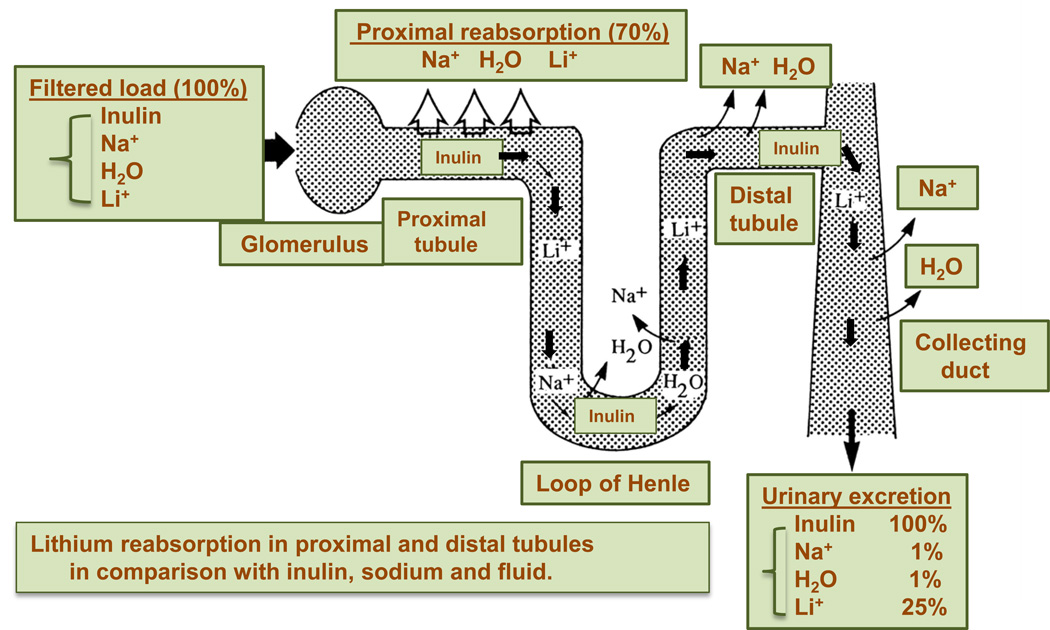
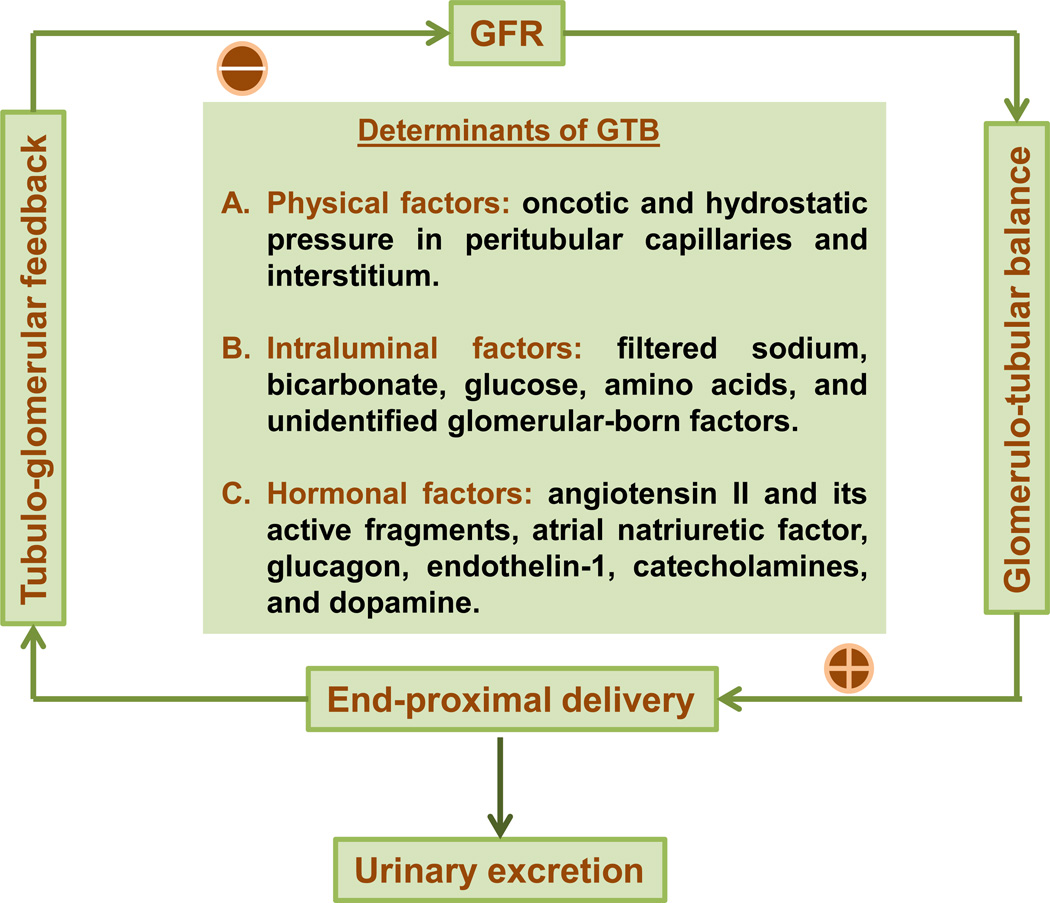
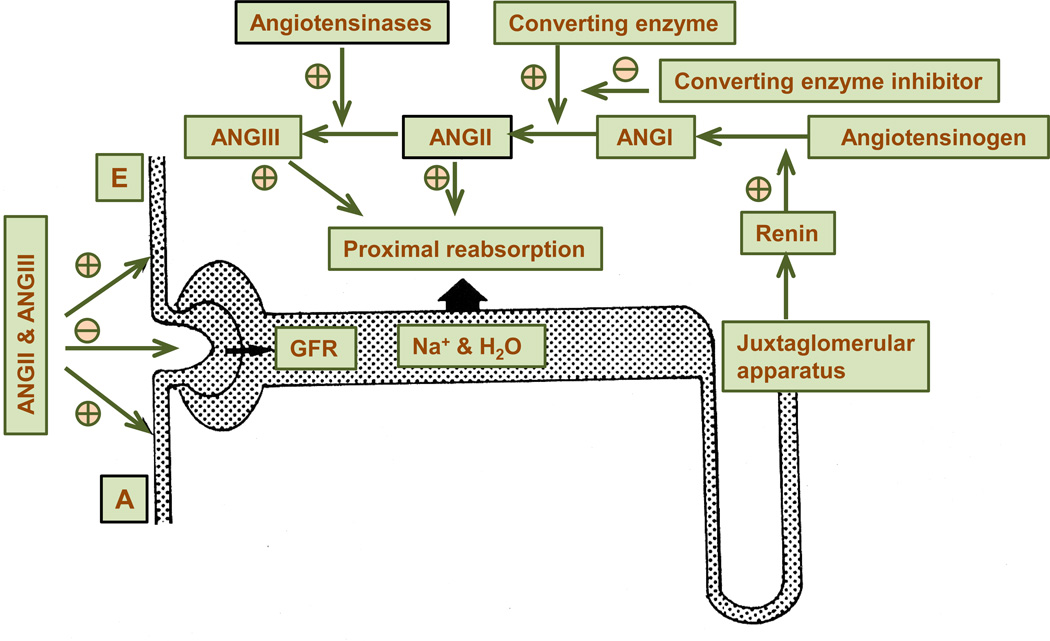
The kidney plays a fundamental role in maintaining body salt and fluid balance and blood pressure homeostasis through the actions of its proximal and distal tubular segments of nephrons. However, proximal tubules are well recognized to exert a more prominent role than distal counterparts. Proximal tubules are responsible for reabsorbing approximately 65% of filtered load and most, if not all, of filtered amino acids, glucose, solutes, and low molecular weight proteins. Proximal tubules also play a key role in regulating acid-base balance by reabsorbing approximately 80% of filtered bicarbonate. The purpose of this review article is to provide a comprehensive overview of new insights and perspectives into current understanding of proximal tubules of nephrons, with an emphasis on the ultrastructure, molecular biology, cellular and integrative physiology, and the underlying signaling transduction mechanisms. The review is divided into three closely related sections. The first section focuses on the classification of nephrons and recent perspectives on the potential role of nephron numbers in human health and diseases. The second section reviews recent research on the structural and biochemical basis of proximal tubular function. The final section provides a comprehensive overview of new insights and perspectives in the physiological regulation of proximal tubular transport by vasoactive hormones. In the latter section, attention is particularly paid to new insights and perspectives learnt from recent cloning of transporters, development of transgenic animals with knockout or knockin of a particular gene of interest, and mapping of signaling pathways using microarrays and/or physiological proteomic approaches.


Figures

Figure 1
Figure 1
Classification and localization of superficial (short-looped, upper) and juxtamedullary (long-looped, lower) nephrons, together with the collecting system. The cortical medullary ray is the part of the cortex that contains the straight proximal tubules, cortical thick ascending limbs, and cortical collecting ducts, delineated by a dashed line. 1, renal corpuscle (Bowman’s capsule and the glomerulus); 2, proximal convoluted tubule; 3, proximal straight tubule; 4, descending thin limb; 5, ascending thin limb; 6, thick ascending limb; 7, macula densa (located within the final portion of the thick ascending limb); 8, distal convoluted tubule; 9, connecting tubule; 9*, connecting tubule of a juxtamedullary nephron that arches upward to form a so-called arcade (there are only a few of these in the human kidney); 10, cortical collecting duct; 11, outer medullary collecting duct; 12, inner medullary collecting duct. Reproduced with permission from Kriz W, Bankir L. (290).
Figure 2
Figure 2
Schematic location and ultrastructure of proximal tubular S1–S3 segments in superficial and juxtamedullary neprhons. For superficial nephrons, S1 segments begin at the urinary pole of the renal corpuscle in the superficial cortex, transform gradually to S2 segments within the labyrinth, and S2 are transformed at different levels within the medullary rays. S3 segments terminate at the border of the outer stripe (OS) to the inner stripe. For juxtamedullary nephrons, S1 and S2 segments start at the urinary pole of the renal corpuscle in the inner cortex, and S3 segments also terminate at the border of the outer stripe (OS) to the inner stripe. A): the S1 segment has the most extensive cellular interdigitation and dense brush border membranes. B): the vacuolar apparatus in the subapical cytoplasm, mitochondria, ER, Golgi apparatus, lysosomes, and peroxisomes in proximal tubule cells. C): the rabbit has tallest brush border microvilli in proximal tubule cells. D): many other species shows shortest microvilli in proximal tubule cells. Reproduced from Kriz and Kaissling with permission (291).
Figure 3
Figure 3
Low resolution profiles and ultrastructures of proximal tubules in the rat kidney. A): profiles of S1, S2 and S3 segments of juxtamedullary proximal tubules with different brush border heights, cytoplasmic density, and outer diameters. Magnification: X ~1000. B): ultrastructures of S1, S2 and S3 proximal tubular cells in the rat kidney. Note that the mitochondria in S1 and S2 are located in lateral cell processes, whereas in S3 they are mainly scattered throughout the cytoplasm. The endocytic apparatus is the subapical cytoplasm is most prominent in S1 and S2 segments (broken lines), whereas endosomes (stars) and lysosomes (L) are localized deeper in the cytoplasm. There are few vacuolar apparatus and lysosomes present in the S3 segment, but peroxisomes (P) are more frequent in this segment. C, capillaries. Magnification: X ~5400 from transmission electron microscopy. Reproduced from Kriz & Kaissling with permission (290).
Figure 4
Figure 4
Localization of Na+-K+-ATPase α1- and γ-subunits and aquaporin-1 (AQP1) in the renal cortex. AQP1 was used as a marker of proximal tubule. Kidney cortex was triple labeled with α1- (red, TSA-Cy3), AQP1 (green, FITC), and γ-subunit (blue, Cy5) antibodies. Proximal segments containing AQP1 stain were lightly labeled with α1- and γ-subunits (bottom right: merged image). Conversely, distal segments that were not labeled by the AQP1 antibody were brightly stained by α1- and γ-subunits (bottom right: merged image). Scale bar, 50 µm. Reproduced from Wetzel and Sweadner with permission (543).
Figure 5
Figure 5
Localization and redistribution of NHE3 during acute hypertension. The endocytic compartment of the proximal tubule was labeled by intravenous injection of horseradish peroxidase (HRP), and rats were sham operated (control), or blood pressure was increased for 20 min (acute hypertension). Kidneys were fixed in situ, sectioned, and double labeled with either polyclonal anti-NHE3 or monoclonal anti-HRP (red). NHE3 is retracted from the body to the base of the microvilli during acute hypertension, with no evidence that NHE3 moves into endocytic tracer HRP-labeled compartment. Reproduced from McDonough with permission (343).
Figure 6
Figure 6
Effects of 2 week infusion of a pressor dose of ANG II and concurrent losartan treatment on phosphorylated or activated NHE3 immunofluorescence staining (A–C, not quantitative) or phospho-NHE3 protein abundance in membrane fractions of proximal tubules of the rat kidney (semi-quantitative). 100 µg proteins were loaded in each lane of western blot gels. *p<0.05 or **p<0.01 vs. control; ††p<0.01 vs. ANG II-infused rats. Reproduced from Li and Zhuo (313).
Figure 7
Figure 7
Effects of 2 week infusion of the non-pressor dose of ANG II and concurrent losartan treatment on phosphorylated NHE3 immunofluorescence staining (A–C, not quantitative) or phospho-NHE3 protein abundance in membrane fractions of proximal tubules of the rat kidney (semi-quantitative). 100 µg proteins were loaded in each lane.of western blot gels. *p<0.05 or **p<0.01 vs. control; ††p<0.01 vs. ANG II-infused rats. Reproduced from Li and Zhuo (313).
Figure 8
Figure 8
Effects of global NHE3 gene knockout on proximal tubule fluid and bicarbonate absorption and blood pressure in adult Slc9a3+/+ (WT) and Slc9a3−/− (NHE-3 knockout) mice. a,b, In situ microperfusion of proximal convoluted tubules revealed that fluid (a) and HCO3 (b) absorption were sharply reduced in Slc9a3−/− tubules (n = 14) relative to Slc9a3+/+ tubules (n = 12). ** P < 0.001; Jv, fluid absorption; JHCO3, HCO3 absorption. c, Blood-pressure measurements using the tail-cuff method showed that systolic pressure was significantly reduced in awake Slc9a3−/− mice (*P < 0.05, n = 4 for each genotype). d, Blood-pressure measurements using a femoral artery catheter showed that mean arterial pressure was reduced (*P < 0.05) in anaesthetized Slc9a3−/− mice (n = 12) compared with both Slc9a3+/− (n = 7) and Slc9a3+/+ (n = 10) mice. Values for all analyses are mean s.e.m. Reproduced from Schultheis et al. (451).
Figure 9
Figure 9
Localization of the sodium and glucose cotransporter 2 (SGLT2) mRNAs in the kidney tubules by in situ hybridization. (a) Low power micrograph showing the pattern of hybridization of Hu 14 antisense cRNA probe (35S-labeled) to rat kidney cryosections. A strong hybridization is detected over tubules in the cortex (C), whereas the signal is absent in outer medulla (OM), inner medulla (IM), and papilla (P). (b–d) Sequential 5 µm sections of rat kidney cortex hybridized with Hu14 antisense cRNA probe (b) or stained with antibodies against the S1 segment specific marker GLUT2 (c) or carbonic anhydrase IV (d), which is specific for S2 segments of proximal tubules and the thick ascending limbs of Henle's loop. A strong hybridization signal is evident in b and is localized over tubules that show a basolateral staining for GLUT2 (indicated as SI in c). In contrast, carbonic anhydrase IV positive tubules (indicated as S2 in d) do not contain a Hu14 hybridization signal. The S3 segment-specific anti-ecto ATPase antibody did not stain tubules in the field corresponding to b and ecto-ATPase-positive tubules detected in other areas of the kidney did not contain Hu14 hybridization signal (not shown). Bar, 0.4 mm (a) and 0.1 mm (b–d). Reproduced from Kenai et al. with permission (259).
Figure 10
Figure 10
Effects of SGLT2 knockout on glucose reabsorption in the early proximal tubule of SGLT2−/− mice, as revealed by in vivo micropuncture studies under anesthesia. (A) Free-flow collections of tubular fluid are performed along accessible proximal tubules at the kidney surface to establish a profile for FR-glucose versus FR-fluid. (B and C) Mean FR-glucose (B) and fractional reabsorption of chloride (C) for early (FR-fluid <40%) and late (FR-fluid ≥40%) proximal tubular collections and up to the urine (n = 18 to 23 nephrons in four to five mice). *P < 0.001 versus WT mice. Reproduced from Vallon et al. with permission (516).
Figure 11
Figure 11
A–E: effect of intracellular microinjection of ANG II (1 nM, ~70–100 fl) on [Ca2+]i responses in single proximal tubule cells at baseline (0 s) and 15, 30, 60, and 120 s after microinjection of Ang II in the cells. F: relative levels of [Ca2+]i signaling before and after microinjection of Ang II. Red represents the highest level of [Ca2+]i responses, whereas black is the background. **P < 0.01 vs. basal. Reproduced from Zhuo et al. with permission (592).
Figure 12
Figure 12
Model of acid-base transport in the proximal tubule (PT). The PT reabsorbs HCO3 by using active-transport processes to secrete H+ into the tubule lumen and titrating HCO3 to CO2 and H2O. Thus, HCO3 reabsorption requires CO2 uptake across the apical membrane. Once inside the cell, CO2 and H2O recombine to regenerate HCO3, which exits across the basolateral membrane. NHE3, Na-H exchanger 3; AQP1, aquaporin 1; CA II and CA IV, carbonic anhydrases II and IV; NBCe1-A, electrogenic Na/HCO3 co-transporter 1, splice variant A. Reproduced from Boron with permission (59).
Figure 13
Figure 13
Osmolality in plasma and late proximal tubular (LPT) fluid in aquaporin-1 (AQP1)-knockout (−/−) and wild-type (+/+) mice. Values are means ± SE and are shown for AQP1 +/+ (n = 21 nephrons in 4 mice), AQP1 −/− (n = 24/5), and hydrated AQP1 −/− mice (n = 19/3). A: relationship between absolute values of osmolalities in plasma and late proximal tubule fluid (where SE bars cannot be seen, they are smaller than the symbol used). B: transtubular osmotic gradients, i.e., the osmolality differences (e) between plasma and LPT. * P < 0.001 compared with AQP1 +/+ mice. Reproduced from Vallon et al. with permission (517).
Figure 14
Figure 14
Normal renal handling of lithium reabsorption in proximal tubules in comparison with those of inulin, sodium and water in rodents and humans with a normal sodium intake. Data are drawn from Refs. (449; 463; 495; 496).
Figure 15
Figure 15
A schematic diagram showing physical, intraluminal and humoral factors that regulate glomerulotubular balance (GTB). ⊕, increase. ⊘, decrease.
Figure 16
Figure 16
In vitro autoradiographic mapping of: (A) active renin binding in justaglomerular apparatus in the dog kidney pretreated with sodium depletion using the radiolabeled renin inhibitor, 125I-H77, (B) angiotensin I-converting enzyme binding in proximal tubules of the rat kidney using 125I-351A, (C) AT1 receptor in the presence of the AT2 receptor blocker PD123319 or (D) AT2 receptor binding in the presence of the AT1 receptor blocker losartan using 125I-[Sar1,Ile8]-ANG II, (E) ANG (1–7) receptor binding in the rat kidney using 125I-ANG (1–7) as the radioligand, and (F) ANG IV receptor binding in the rat kidney using 125I-ANG (3–8). The levels of binding are indicated by color calibration bars with red representing the highest, whereas blue showing the lowest levels of enzyme or receptor binding. G: glomerulus. IM: inner medulla. IS: inner stripe of the outer medulla. JGA: juxtaglomerular apparatus. P: proximal tubule. Reproduced from Zhuo and Li with permission (591).
Figure 17
Figure 17
A schematic representation of local generation of ANG II in proximal tubules of the kidney and its role in the regulation of proximal tubular reabsorption and glomerulotubular balance (GTB). ⊕, stimulation. ⊘, inhibition.
Figure 18
Figure 18
Schematic depiction of dopamine formation and cell signaling mechanisms activating sodium transport across the proximal renal tubule cell. DA indicates dopamine; D1R, dopamine D1 receptor; PLC, phospholipase C; DAG, diacylglycerol;and AC, adenylyl cyclase. Reproduced from Carey with permission (81).
Figure 19
Figure 19
A schematic diagram showing GRK4 and renal dopamine and ANG II type 1 receptor interactions to regulate renal tubular transport and blood pressure homeostasis. During conditions of moderately increased NaCl intake, the renal D1R is stimulated by dopamine produced in the kidney. The D1R or D3R, whose coupling to G protein subunits is regulated by G protein-coupled receptor kinase type 4 (GRK4), inhibits sodium reabsorption in several nephron segments. This results in an increase in sodium excretion and maintenance of normal blood pressure. GRK4 wild-type (GRK4 WT) also negatively regulates AT1R transcription. The decrease in AT1R expression, caused by GRK4 WT, facilitates the inhibitory effect of D1R on renal sodium transport. In essential hypertension, constitutively active variants of GRK4 not only uncouple D1R and D3R from G protein subunits, but also increase AT1R transcription in the kidney. These effects impair the ability of the kidney to excrete the excess sodium load, resulting in sodium retention, and ultimately hypertension. Green box = normal coupling of D1R and D3R to G protein subunits, Red box = uncoupling of D1R and D3R from G protein subunits. Green arrows = stimulatory, Red arrows = inhibitory. Reproduced from Jose with permission (254).
Figure 20
Figure 20
The intrarenal distribution of ANF receptors in the rat kidney, as visualized by quantitative in vitro autoradiography using [125I]-labeled ANF as the radioligand. High levels of ANF receptor binding occur in the glomeruli (G) and the inner medulla (IM), whereas moderate levels of ANF binding are seen in the proximal convoluted tubules (PCT) and inner stripe of the outer medulla (VRB). Red represents highest whereas black the lowest levels of ANF receptor binding. Reproduced from Zhuo and Mendelsohn with permission (583).
Figure 21
Figure 21
Schematic representation of potential multi-level interactions between ANF and ANG II to regulate renal hemodynamics and proximal tubular transport of sodium and fluid in the kidney. A, afferent arteriole. E, efferent arteriole. AI, ANG I. AII, ANG II. CE, converting enzyme. CEI, converting enzyme inhibitor. Kf, ultrafiltration coefficient. ⊕, stimulation or increase. ⊘, inhibition or decrease.
Figure 22
Figure 22
The intrarenal distribution of endothelin 1 (ET-1) receptors in the rat kidney, as visualized by quantitative in vitro autoradiography using [125I]-endothelin 1 as the radioligand. High levels of ET-1 receptor binding occur in the inner medulla (IM) and glomeruli (G), whereas moderate levels of ET-1 binding are seen in the proximal convoluted tubules (PCT) and inner stripe of the outer medulla (VRB). Red represents highest whereas black the lowest levels of ET-1 receptor binding. Reproduced from Zhuo and Mendelsohn with permission (580; 583).
Figure 23
Figure 23
Relationship between the rates of single nephron GFR (SNGFR) and proximal tubular fluid reabsorption of WT, ACE 2/2, and ACE 1/3 mice during control (top) and during angiotensin II infusion (bottom). Lines are linear regression lines calculated for the range of the data. Reproduced from Hashimoto et al. with permission (206).
Figure 24
Figure 24
Expression of an intracellular cyan fluorescent fusion of ANG II, ECFP/ANG II, selectively in freshly isolated proximal tubules of the rat kidney 2 weeks after intrarenal ECFP/ANG II transfer. The SGLT2 gene promoter was used to drive ECFP/ANG II expression selectively in proximal tubules of the kidney. Bars = 10 µm for the proximal tubule or 30 µm for the glomerulus. Reproduced from Li et al. with permission (310).
Figure 25
Figure 25
Effects of proximal tubule-specific transfer of ECFP/ANG II or its scrambled control, ECFP/ANG IIc, with or without losartan treatment on systolic blood pressure in rats (SBP; A) or ECFP/ANG II transfer in wild-type or AT1a-KO mice (B). *p< 0.05 or **p< 0.01 vs. basal SBP. +p< 0.05 or ++p< 0.01 vs. SBP in ECFP/ANG II-transferred rats. #p< 0.05 or ++p< 0.01 vs. SBP in wild-type mice at basal or 2 weeks after intrarenal ECFP/ANG II transfer. Reproduced from Li et al. with permission (310).

References

    1. Abuladze N, Lee I, Newman D, Hwang J, Pushkin A, Kurtz I. Axial heterogeneity of sodium-bicarbonate cotransporter expression in the rabbit proximal tubule. Am J Physiol. 1998;274:F628–F633. - PubMed
    1. Adachi M, Yang YY, Furuichi Y, Miyamoto C. Cloning and characterization of cDNA encoding human A-type endothelin receptor. Biochem Biophys Res Commun. 1991;180:1265–1272. - PubMed
    1. Aizman O, Aperia A. Na,K-ATPase as a signal transducer. Ann N Y Acad Sci. 2003;986:489–496. 489–496. - PubMed
    1. Albrecht FE, Drago J, Felder RA, Printz MP, Eisner GM, Robillard JE, Sibley DR, Westphal HJ, Jose PA. Role of the D1A dopamine receptor in the pathogenesis of genetic hypertension. J Clin Invest. 1996;97:2283–2288. - PMC - PubMed
    1. Alpern RJ. Cell mechanisms of proximal tubule acidification. Physiol Rev. 1990;70:79–114. - PubMed

Publication types