. 2013 Sep 13;288(37):26569-82.
doi: 10.1074/jbc.M113.489310. Epub 2013 Jul 29.

Alteration of endoplasmic reticulum lipid rafts contributes to lipotoxicity in pancreatic β-cells

Affiliations

Alteration of endoplasmic reticulum lipid rafts contributes to lipotoxicity in pancreatic β-cells

Ebru Boslem et al. J Biol Chem. .

Abstract

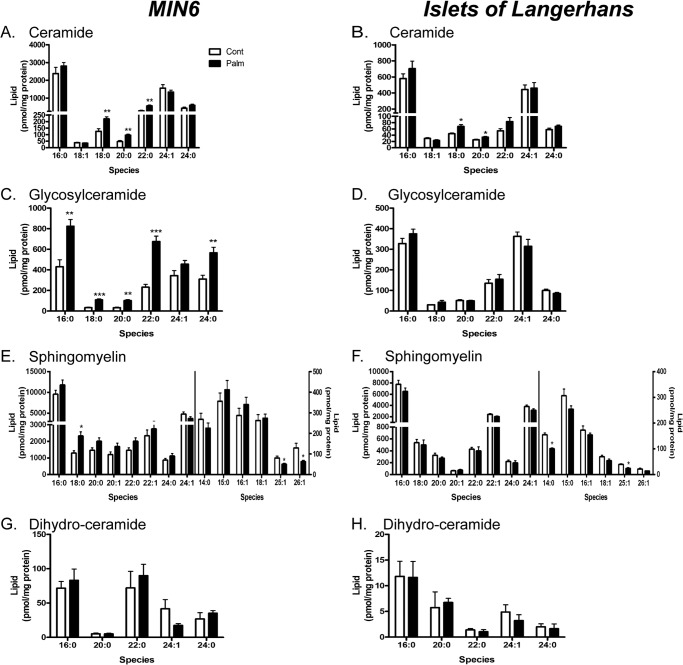
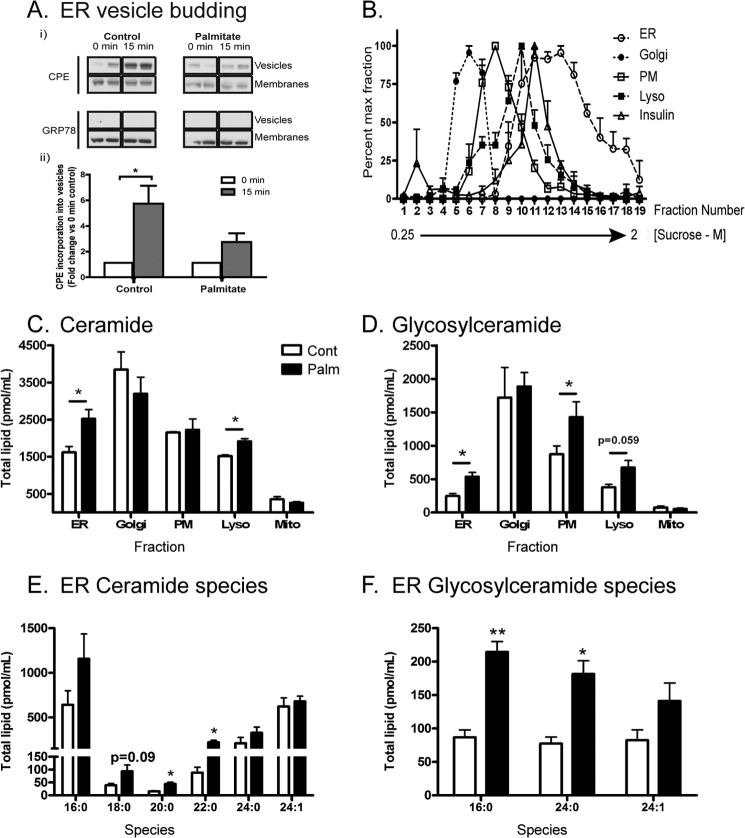
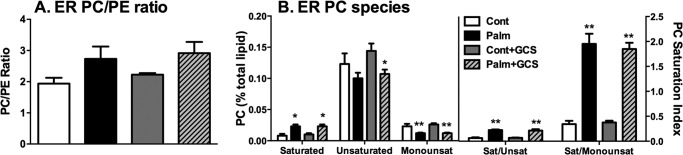
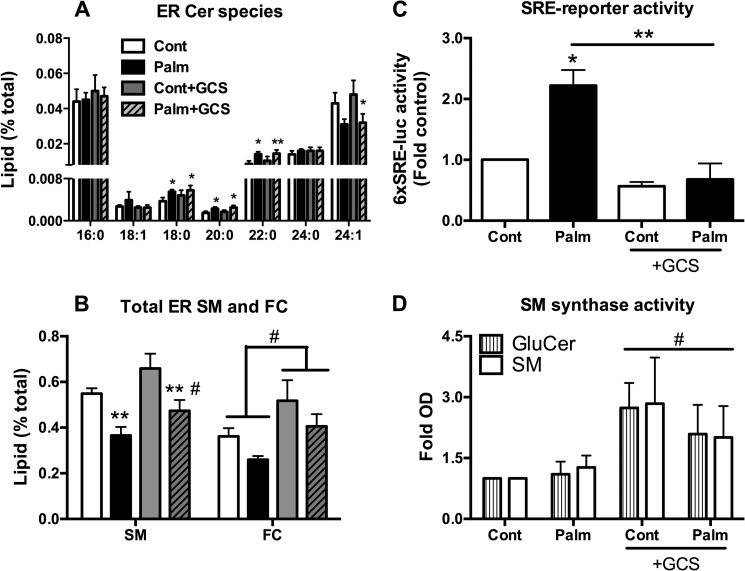
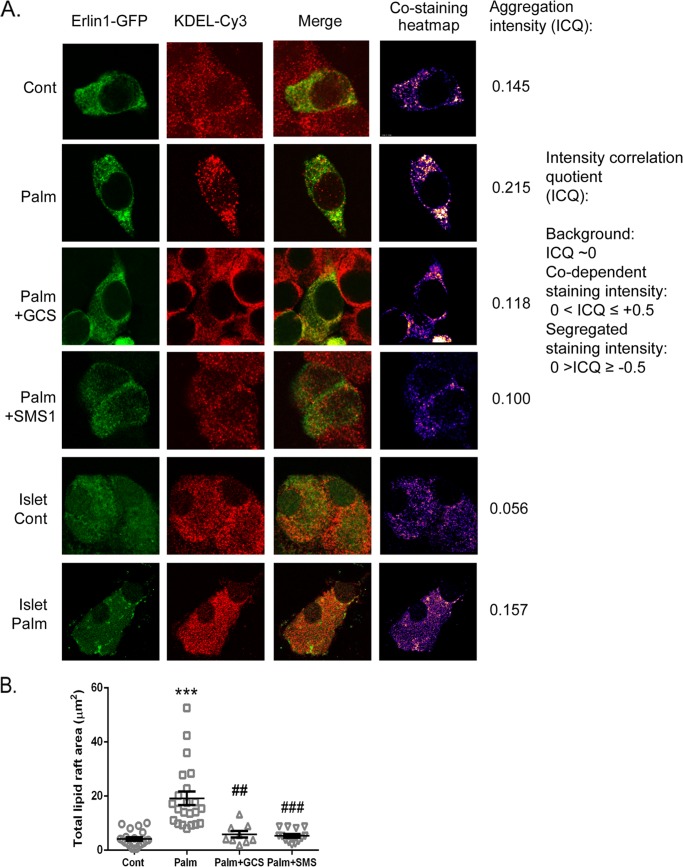
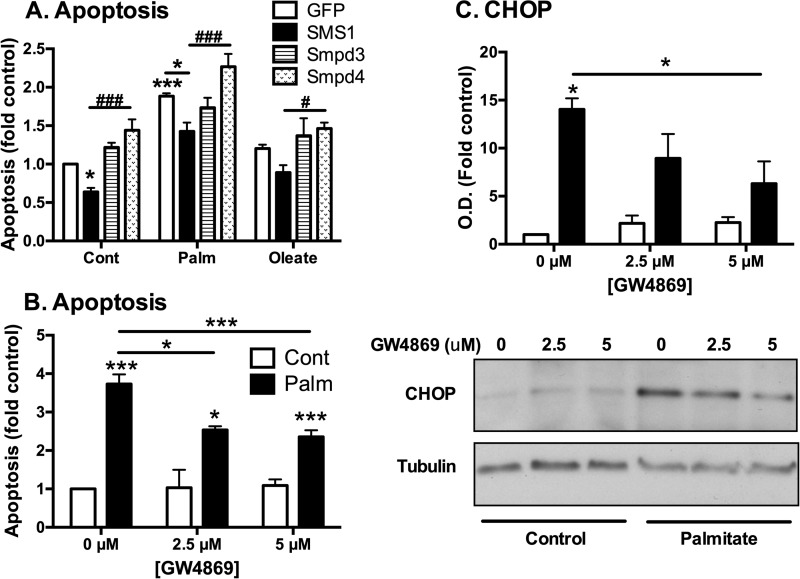
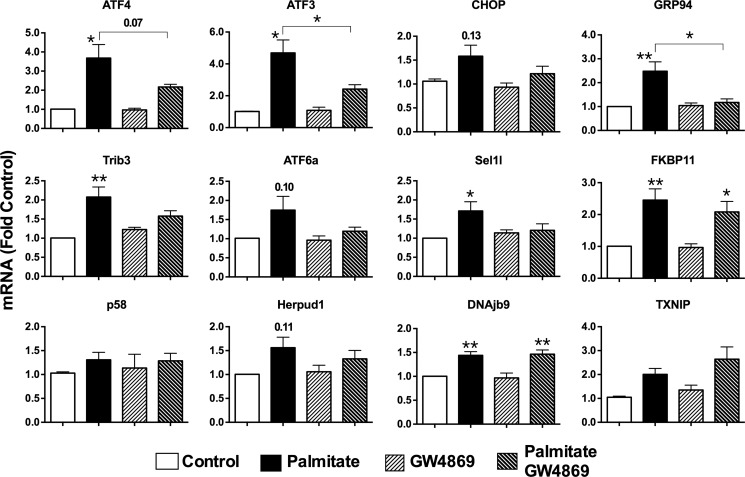
Chronic saturated fatty acid exposure causes β-cell apoptosis and, thus, contributes to type 2 diabetes. Although endoplasmic reticulum (ER) stress and reduced ER-to-Golgi protein trafficking have been implicated, the exact mechanisms whereby saturated fatty acids trigger β-cell death remain elusive. Using mass spectroscopic lipidomics and subcellular fractionation, we demonstrate that palmitate pretreatment of MIN6 β-cells promoted ER remodeling of both phospholipids and sphingolipids, but only the latter was causally linked to lipotoxic ER stress. Thus, overexpression of glucosylceramide synthase, previously shown to protect against defective protein trafficking and ER stress, partially reversed lipotoxic reductions in ER sphingomyelin (SM) content and aggregation of ER lipid rafts, as visualized using Erlin1-GFP. Using both lipidomics and a sterol response element reporter assay, we confirmed that free cholesterol in the ER was also reciprocally modulated by chronic palmitate and glucosylceramide synthase overexpression. This is consistent with the known coregulation and association of SM and free cholesterol in lipid rafts. Inhibition of SM hydrolysis partially protected against ATF4/C/EBP homology protein induction because of palmitate. Our results suggest that loss of SM in the ER is a key event for initiating β-cell lipotoxicity, which leads to disruption of ER lipid rafts, perturbation of protein trafficking, and initiation of ER stress.

Keywords: Ceramide; ER Lipid Raft; Endoplasmic Reticulum Stress; Lipidomics; Lipotoxicity; Palmitate; Pancreatic Islets; Sphingomyelin; Trafficking; Type 2 Diabetes.


Figures

FIGURE 1.
FIGURE 1.
Chronic palmitate treatment (48 h) induces similar sphingolipid species changes within MIN6 cells and islets of Langerhans. MIN6 cells (left panel) or WT islets ex vivo (right panel) were cultured with 0.4 mm palmitate complexed to BSA (0.92%) for 48 h before total lysates were prepared for quantification of all major sphingolipid species via mass spectrometry. Each species was corrected for total protein content of lysates. Data represent mean ceramide (A and B), glycosylceramide (C and D), sphingomyelin (E and F), and dihydroceramide (G and H) species from six (MIN6) or four (islet) independent experiments + S.E. *, p < 0.05; **, p < 0.01, ***, p < 0.001; paired Student's t tests compared with control condition.
FIGURE 2.
FIGURE 2.
Subcellular changes in MIN6 cells because of palmitate treatment (48 h) include inhibition of ER vesicle budding and enhanced ceramide accrual. A, microsomes (chiefly ER) were prepared from MIN6 cells pretreated with 0.4 mm palmitate/0.92% BSA. Isolated microsomes underwent a budding assay (see “Experimental Procedures”) to probe the rate of carboxypeptidase E (CPE) incorporation into ER vesicle buds over 15 min. Grp78/BiP (excluded from buds) was used as a negative control. Results are presented as representative blots (each condition in duplicate) from a total of three independent experiments (i) or as densitometry relative to 0-min control (n = 3) (ii). B, MIN6 cells were pretreated with 0.4 mm palmitate/0.92% BSA (48 h) before lysis and fractionation. The position of subcellular peaks within the sucrose gradient corresponding to the ER, Golgi, plasma membrane (PM), lysosome (Lyso), and insulin granules as characterized by organelle markers (see “Experimental Procedures”). C, mass spectrometry of total ceramide and glycosylceramide (D) content from peak fractions corresponding to each compartment and expressed as total lipid per milliliter of sucrose fraction extract. Peak fractions are as follows: ER, 13–18; Golgi, 5–8; lysosome, 11–12; and plasma membrane, 9–10. Mitochondria (Mito) were isolated separately (see “Experimental Procedures”). Cont, control; Palm, palmitate. The specific ER ceramide (E) and glycosylceramide (F) species accumulating in response to palmitate are detailed. Data represent mean ± S.E. from three independent experiments. *, p < 0.05, unpaired Student's t test compared with control condition.
FIGURE 3.
FIGURE 3.
MIN6 cell ER PC species and saturation. A, MIN6 cells were pretransfected ± the GCS construct and then treated chronically (48 h) with 0.4 mm palmitate (Palm)/0.92% BSA and fractionated. Then, peak ER fractions were quantified via mass spectrometry. The ER PC/PE ratio represents the ratio of mean PC to PE lipid (percent of total lipid content) + S.E. from three independent experiments. B, saturated (Sat), unsaturated (Unsat) (≥ 1 double bond), and monounsaturated (Monounsat) (= 1 double bond) ER PC species (left panel) and those species represented as ratios (right panel). Data represents mean lipid (percent of total lipid content) + S.E. from three independent experiments. *, p < 0.05; **, p < 0.01; unpaired Student's t test compared with control. Con, control.
FIGURE 4.
FIGURE 4.
ER sphingolipid profiling implicates altered SM and FC content in the protection afforded by GCS overexpression. MIN6 cells were pretreated chronically (48 h) with 0.4 mm palmitate (Palm)/0.92% BSA and fractionated, and then peak ER fractions were quantified via mass spectrometry. A, ceramide species from the ER fraction ± GCS overexpression. *, p < 0.05; **, p < 0.01; paired Student's t test compared with control. Cont, control. B, total SM and FC content of the ER ± GCS overexpression. ** and #, p < 0.05; paired Student's t test compared with control (*) or palmitate (#) GCS conditions. Data in A and B represent mean lipid (percent of total lipid content) + S.E. from three independent experiments. C, fold 6xSRE-luciferase activity (luminescence) from MIN6 cells cotransfected with 6xSRE-tagged firefly luciferase reporter construct and Renilla luciferase (to correct for transfection efficiency) ± GCS construct prior to lipid treatment as a measure of 6xSRE-driven cholesterol gene expression. Data represent mean fold + S.E. from four independent experiments. D, GCS and SMS1 activity was measured via the acute (1-h) conversion of fluorescent NBD-labeled Cer to GluCer and SM in MIN6 cells ± GCS overexpression. #, p < 0.05; paired Student's t test, construct (GCS) effect versus GFP over both control and palmitate conditions.
FIGURE 5.
FIGURE 5.
Palmitate-induced alterations in ER sphingomyelin and cholesterol are implicated in the disruption of ER lipid raft distribution. A, MIN6 cells or primary islet cell monolayers were transfected with the ER raft marker Erlin1-GFP (green) prior to 0.4 mm palmitate (Palm)/0.92% BSA treatment (48 h). Fixed cells were stained with anti-KDEL antibody (a marker of the ER-resident proteins Grp94 and Bip) and Cy3 secondary (red) to verify ER localization of Erlin-1. The visual representation of the intensity of positive red and green costaining areas was generated on a costaining heatmap by intensity correlation analysis plugin (16) (Image J), plotting areas of low-to-high (blue-to-white) intensity. Scale bar = 10 μm. B, total mean lipid raft area ± S.E. (μm2) of MIN6 Erlin-GFP images. ***, p < 0.001 versus control; ##, p < 0.01; ###, p < 0.001 versus palmitate; Kruskal-Wallis test with Dunn's multiple comparisons. Images are representative of mean ICQ and raft area values from three to six independent experiments (Cont, Palm, +GCS, and +SMS conditions).
FIGURE 6.
FIGURE 6.
SM content and SMase activity play a significant role in palmitate-induced ER stress and apoptosis. A, MIN6 cells were transfected with GFP, SMS1, Smpd3, or Smpd4 constructs prior to 48-h palmitate (Palm) or oleate (0.4 mm/0.92% BSA) treatment and then quantified for the level of apoptosis. #, p < 0.05; ###, p < 0.001; two-way analysis of variance with Bonferroni's multiple comparisons of Smpd4 to SMS1 where indicated; *, p < 0.05; ***, p < 0.001; unpaired Student's t tests compared with GFP control unless indicated. Data represent mean apoptosis (fold control) + S.E. from three to four independent experiments. Cont, control. B, MIN6 cells were cultured with 0.4 mm palmitate complexed to BSA (0.92%) ± SMase inhibitor, GW4869, for 48 h before total lysates were prepared for the quantification of apoptosis (DNA fragmentation via cell death ELISA, Roche) or CHOP induction (immunoblotting) (C). *, p < 0.05; **, p < 0.01; ***, p < 0.001; two-way analysis of variance with Bonferroni's multiple comparisons to control (0 μm) or where indicated.
FIGURE 7.
FIGURE 7.
Inhibition of SMase activity differentially regulates UPR gene expression. MIN6 cells were cultured for 48 h with 0.4 mm palmitate complexed to BSA (0.92%) ± SMase inhibitor, GW4869 (5 μm). mRNA was isolated, converted to cDNA, and analyzed by real-time PCR. *, p < 0.05; **, p < 0.01 for effect of inhibitor versus control or palmitate alone group or as indicated using one-way analysis of variance with Tukey's multiple comparisons. Data are mean ± S.E. from three to four independent experiments.

References

    1. Paolisso G., Tataranni P. A., Foley J. E., Bogardus C., Howard B. V., Ravussin E. (1995) A high concentration of fasting plasma non-esterified fatty acids is a risk factor for the development of NIDDM. Diabetologia 38, 1213–1217 - PubMed
    1. Kahn S. E., Hull R. L., Utzschneider K. M. (2006) Mechanisms linking obesity to insulin resistance and type 2 diabetes. Nature 444, 840–846 - PubMed
    1. Weir G. C., Bonner-Weir S. (2004) Five stages of evolving β-cell dysfunction during progression to diabetes. Diabetes 53, S16–21 - PubMed
    1. Shimabukuro M., Higa M., Zhou Y. T., Wang M. Y., Newgard C. B., Unger R. H. (1998) Lipoapoptosis in β-cells of obese prediabetic fa/fa rats. Role of serine palmitoyltransferase overexpression. J. Biol. Chem. 273, 32487–32490 - PubMed
    1. El-Assaad W., Joly E., Barbeau A., Sladek R., Buteau J., Maestre I., Pepin E., Zhao S., Iglesias J., Roche E., Prentki M. (2010) Glucolipotoxicity alters lipid partitioning and causes mitochondrial dysfunction, cholesterol, and ceramide deposition and reactive oxygen species production in INS832/13 ss-cells. Endocrinology 151, 3061–3073 - PubMed

Publication types

LinkOut - more resources