. 2013 Jun;25(6):2155-70.
doi: 10.1105/tpc.113.113076. Epub 2013 Jun 28.

Molecular architecture of plant thylakoids under physiological and light stress conditions: a study of lipid-light-harvesting complex II model membranes

Affiliations

Molecular architecture of plant thylakoids under physiological and light stress conditions: a study of lipid-light-harvesting complex II model membranes

Ewa Janik et al. Plant Cell. 2013 Jun.

Abstract

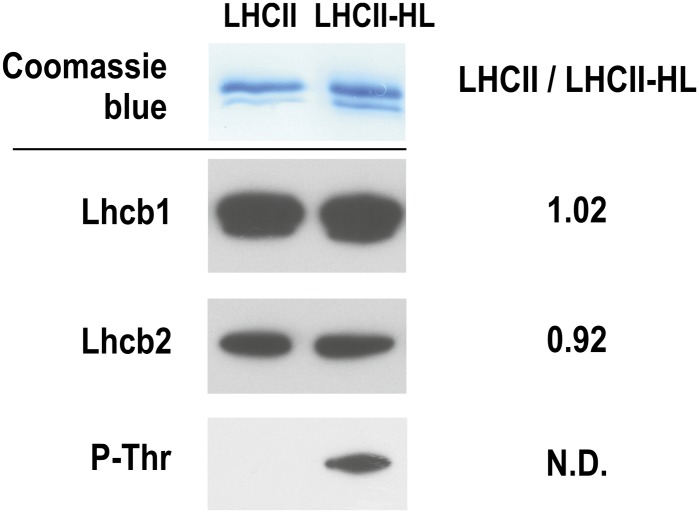
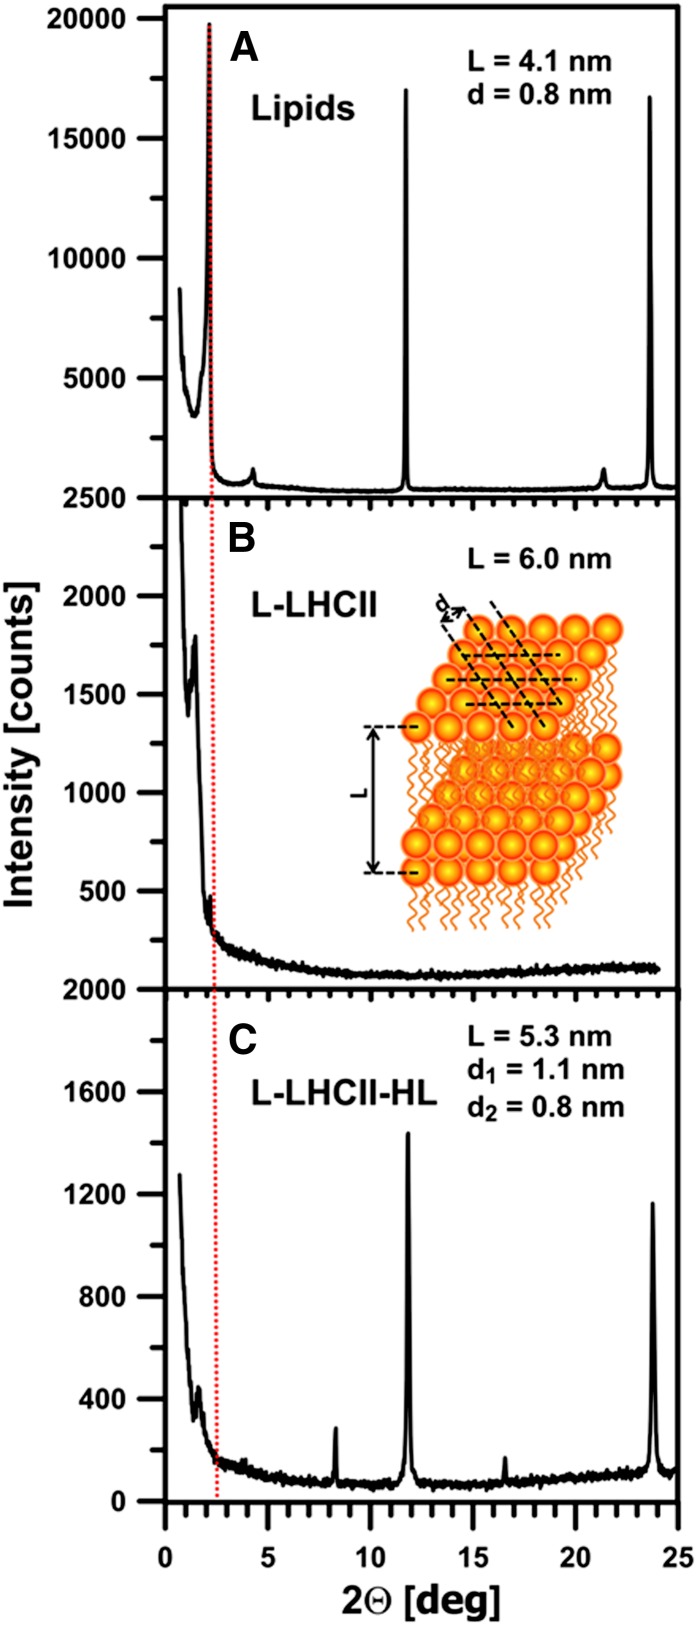
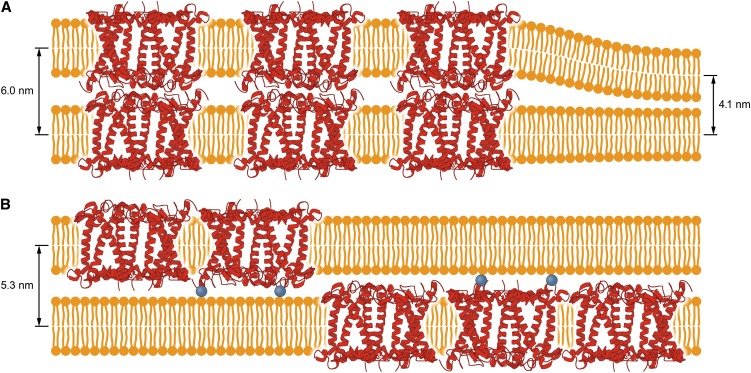
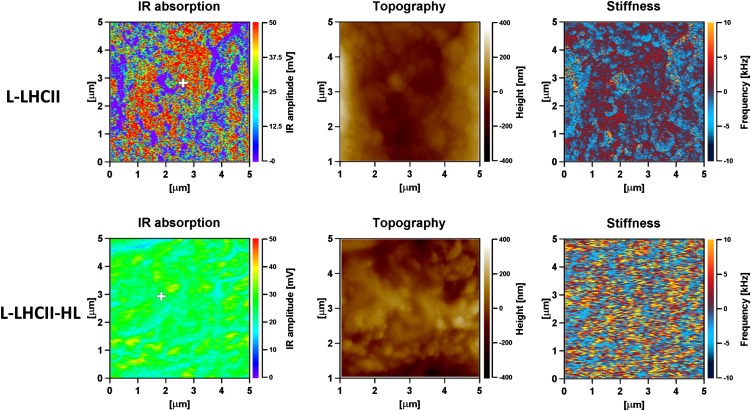
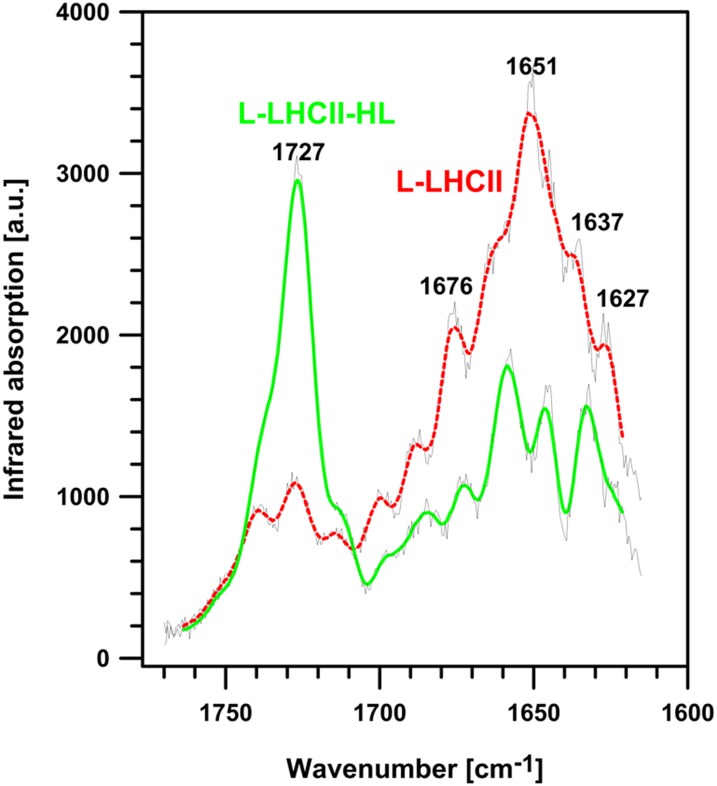
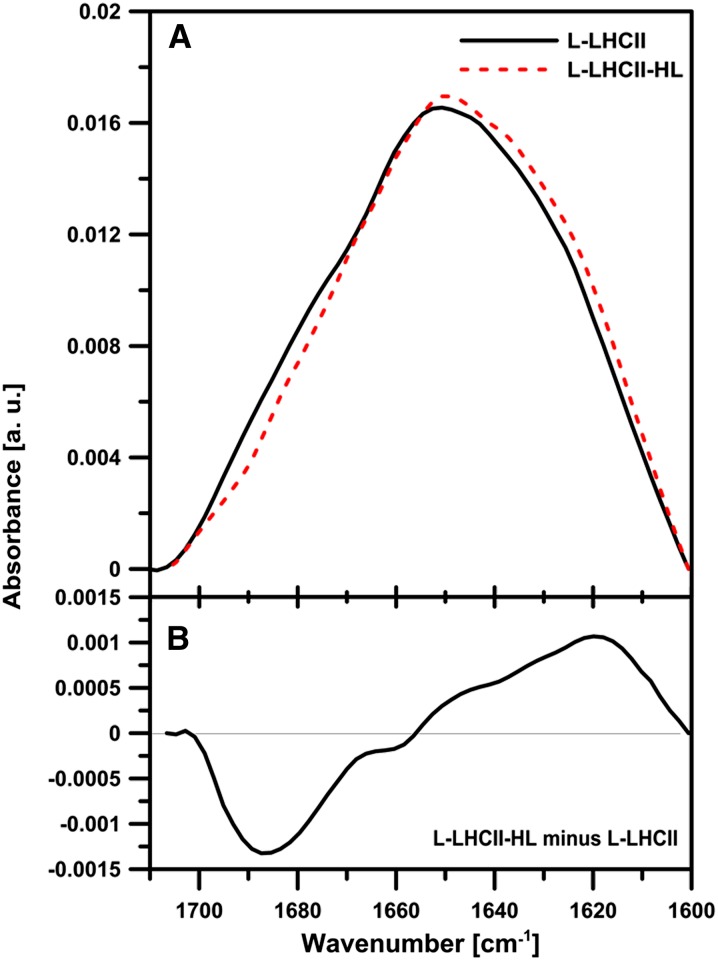
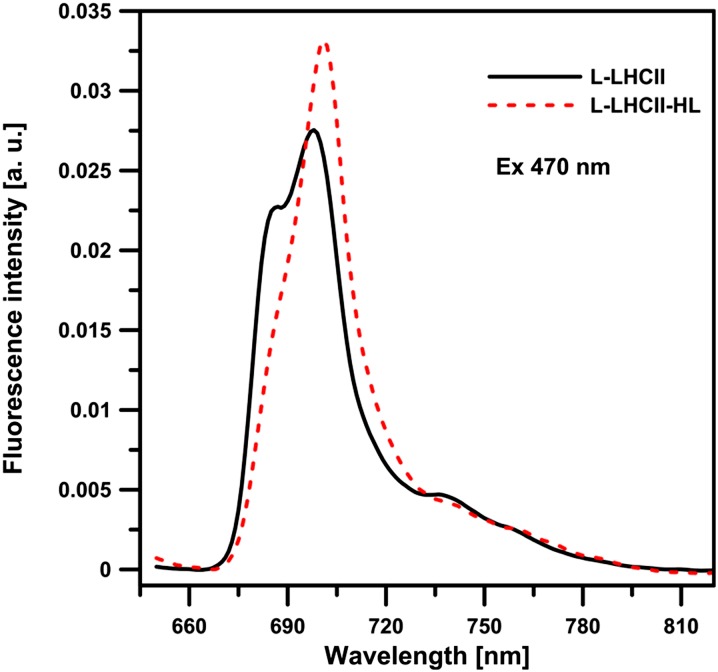
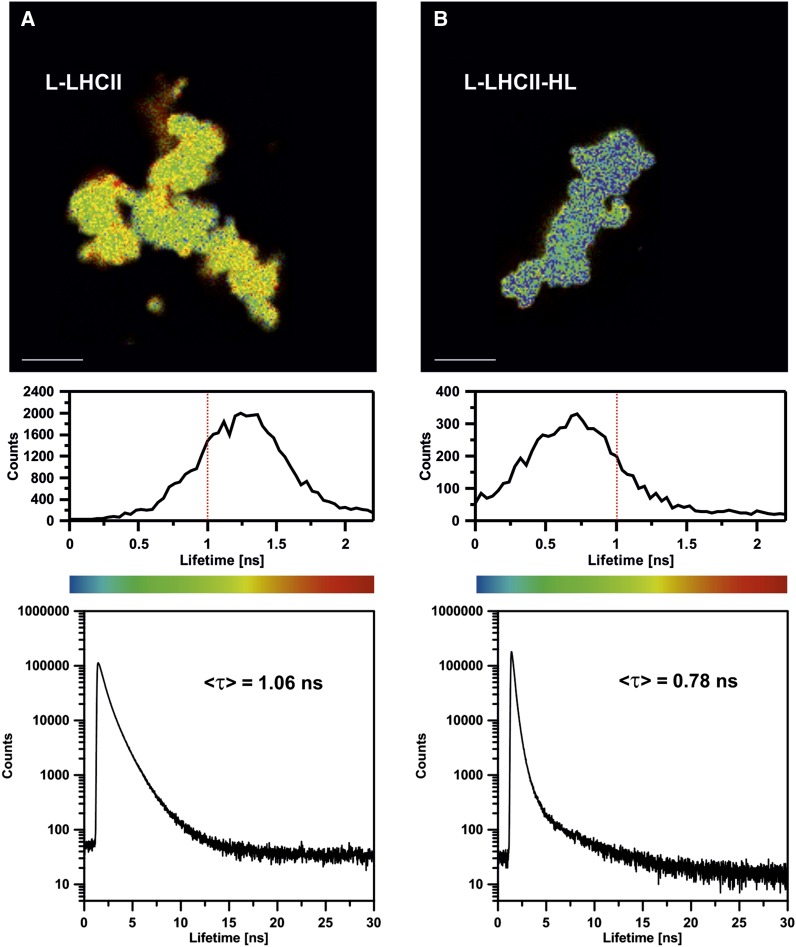
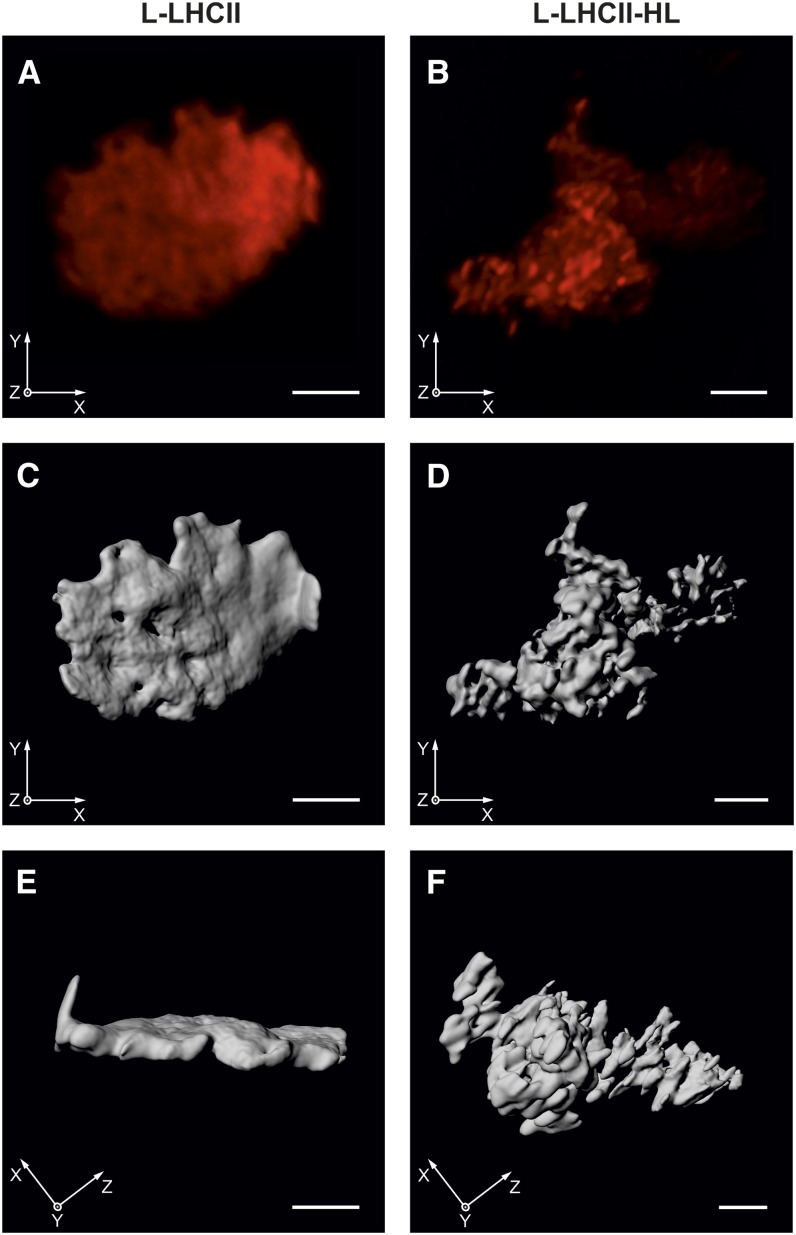
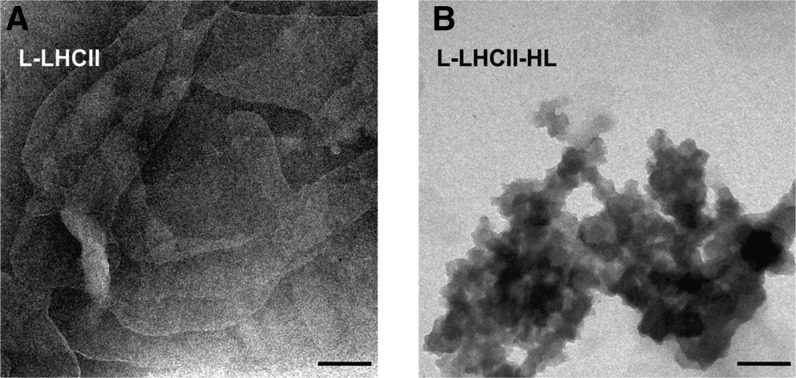
In this study, we analyzed multibilayer lipid-protein membranes composed of the photosynthetic light-harvesting complex II (LHCII; isolated from spinach [Spinacia oleracea]) and the plant lipids monogalcatosyldiacylglycerol and digalactosyldiacylglycerol. Two types of pigment-protein complexes were analyzed: those isolated from dark-adapted leaves (LHCII) and those from leaves preilluminated with high-intensity light (LHCII-HL). The LHCII-HL complexes were found to be partially phosphorylated and contained zeaxanthin. The results of the x-ray diffraction, infrared imaging microscopy, confocal laser scanning microscopy, and transmission electron microscopy revealed that lipid-LHCII membranes assemble into planar multibilayers, in contrast with the lipid-LHCII-HL membranes, which form less ordered structures. In both systems, the protein formed supramolecular structures. In the case of LHCII-HL, these structures spanned the multibilayer membranes and were perpendicular to the membrane plane, whereas in LHCII, the structures were lamellar and within the plane of the membranes. Lamellar aggregates of LHCII-HL have been shown, by fluorescence lifetime imaging microscopy, to be particularly active in excitation energy quenching. Both types of structures were stabilized by intermolecular hydrogen bonds. We conclude that the formation of trans-layer, rivet-like structures of LHCII is an important determinant underlying the spontaneous formation and stabilization of the thylakoid grana structures, since the lamellar aggregates are well suited to dissipate excess energy upon overexcitation.


Figures

Figure 1.
Figure 1.
Characterization of Protein Components of LHCII Preparations. Proteins were separated using SDS-PAGE (top panel) and subsequently probed against Lhcb1 and Lhcb2 proteins and phosphor-Thr residue (P-Thr; bottom panel). LHCII/LHCII-HL ratios are calculated on the basis of pixel intensity analysis. The nonphosphorylated and phosphorylated LHCII complexes were isolated from the spinach leaves dark-adapted and preilluminated for 30 min with white light of the photon flow density of 1200 μmol photons m−2 s−1. The photon flux density, of the lamp applied, is an equivalent of 1020 µmol photons m−2 s−1 of the sunlight, in terms of a number of absorbed light quanta (see Supplemental Figure 1 online for details of this estimation). Comparative immunoblot analysis reveals 35% phosphorylation of LHCII, relative to the low-light illumination conditions (see Supplemental Figure 3 online). N.D., not determined. [See online article for color version of this figure.]
Figure 2.
Figure 2.
Diffractometric Analysis of Lipid-Protein Multibilayers. Original diffractograms of lipid (MGDG+DGDG) multibilayers modified with LHCII complexes. Red vertical dashed line indicates the low-angle maximum corresponding to the periodicity of the multibilayer formed with pure lipids. The inset is a schematic representation of a part of the lipid multibilayer. Parameters L and d refer to the Bragg’s spacing related to the low-angle and wide-angle diffraction maxima, respectively. The value of parameters L and d were determined on the basis of a position of diffractometric maxima according to Bragg’s law. Note the two different d spacing parameters determined in the case of the L-LHCII-HL multibilayers. (A) Multibilayers composed of the mixture of MGDG and DGDG in a molar ratio of 2:1 (Lipids). (B) Lipid multibilayers modified with LHCII complexes isolated from dark-incubated leaves (L-LHCII). (C) Lipid multibilayers modified with LHCII complexes isolated from leaves preilluminated with high-intensity light (L-LHCII-HL). [See online article for color version of this figure.]
Figure 3.
Figure 3.
Model of Molecular Organization of the Lipid-Protein Membranes. The model refers to the membranes formed with LHCII isolated from dark-adapted leaves (A) and leaves preilluminated with high-intensity light (B). Phosphorylation of Thr at the N terminus of LHCII peptide is depicted by blue balls. The diffractometrically determined multibilayer periodicity parameters are shown. For clarity, only the protein components of LHCII is shown. [See online article for color version of this figure.]
Figure 4.
Figure 4.
IR Absorption, Topography of the Surface, and Mechanical Stiffness Images, Recorded Simultaneously from the 5 × 5-μm area of the Lipid-Protein Multibilayer Deposited at the ZnSe Surface, Formed with LHCII Isolated from Dark-Incubated Leaves and Leaves Preilluminated with High-Intensity Light. The samples formed with LHCII are referred to as L-LHCII and formed with LHCII-HL are referred to as L-LHCII-HL. The maximum thickness of the sample was 1.5 μm. The IR absorption was scanned at 1650 cm−1. The white crosses indicate the places in the samples at which the IR absorption spectra were recorded (displayed in Figure 5). Scan resolution X, 512 points; Y, 256 points; and scan rate 0.4 Hz, eight coaverages.
Figure 5.
Figure 5.
IR Absorption Spectra Recorded from the Lipid-Protein Multibilayer Samples L-LHCII and L-LHCII-HL. The spectral region corresponds to the white crosses in Figure 4: The spectrum drawn with red dashed line was recorded from the L-LHCII sample, and the spectrum drawn with green solid line was recorded from the L-LHCII-HL sample (marked). The spectra were recorded in the amide I region of the protein (1600 to 1700 cm−1) and in the ester carbonyl stretching region of the lipid components (1700 to 1750 cm−1). The reference spectrum from the pure buffer evaporated at the surface of the ZnSe crystal was recorded in the same spectral range and under the same conditions. The original spectra are presented with gray lines, superimposed on the processed spectra obtained by smoothing by the Savitzky-Golay procedure (second order polynomial, 15 points). The spectra were recorded with a resolution of 0.5 cm−1, sample rate 12.5 MHz, and 256 coaverages. a.u., arbitrary units. [See online article for color version of this figure.]
Figure 6.
Figure 6.
IR Absorption Analysis of L-LHCII and L-LHCII-HL Samples. (A) Infrared absorption spectra (FTIR) in the amide I region of the lipid-protein multibilayers L-LHCII (solid line) and L-LHCII-HL (dashed line). The spectra were normalized to get the same area beneath each spectrum. (B) Different spectrum calculated on the basis of the spectra presented in the top panel. a.u., arbitrary units. [See online article for color version of this figure.]
Figure 7.
Figure 7.
77K Chlorophyll a Fluorescence Emission Spectra Recorded from the Lipid-Protein Samples L-LHCII and L-LHCII-HL. The spectrum corresponding to the L-LHCII sample is plotted with solid line, and the spectrum corresponding to the L-LHCII-HL sample is plotted with dashed line. Excitation wavelength was at 470 nm. The spectra were normalized to get the same area beneath each spectrum. a.u., arbitrary units. [See online article for color version of this figure.]
Figure 8.
Figure 8.
FLIM Images of the 60 × 60-μm Areas of the Glass Slides Covered with Poly-l-Lys, on Which L-LHCII and L-LHCII-HL Particles Were Deposited from the Aqueous Suspensions of the Samples Diluted to Micromolar Concentration of LHCII. Fluorescence lifetime distribution (middle panel) and fluorescence decay traces (bottom panel) were presented below each image. The intensity-weighted average lifetimes (<τ>) of each scanned sample are displayed, based on the three component deconvolution: 0.49, 1.19, and 3.78 ns (χ2 = 1.003) in the case of L-LHCII and 0.24, 0.59, and 3.78 ns (χ2 = 1.044) in the case of L-LHCII-HL. Lifetime threshold corresponding to 1 ns is marked in histograms by red dashed line. Bars = 10 μm.
Figure 9.
Figure 9.
Chlorophyll a Fluorescence of Lipid-LHCII Samples Revealed by CLSM and Subsequent 3D Reconstruction. The L-LHCII (A) or L-LHCII-HL (B) samples were incubated in buffered medium containing 10 mM KCl. Each red image presents the sum projection of deconvolved stack of CLSM. Gray images represent three-dimensional models of the L-LHCII ([C] and [E]) or L-LHCII-HL ([D] and [F]) created after deconvolution. Face ([C] and [D]) and rotated ([E] and [F]) view of three-dimensional sample models is shown. Bars = 2 μm. [See online article for color version of this figure.]
Figure 10.
Figure 10.
Transmission Electron Microscopy Images of the L-LHCII and L-LHCII-HL Samples. L-LHCII (A) and L-LHCII-HL (B) samples. Bars = 200 nm.

Similar articles

Cited by

References

    1. Ahn T.K., Avenson T.J., Ballottari M., Cheng Y.C., Niyogi K.K., Bassi R., Fleming G.R. (2008). Architecture of a charge-transfer state regulating light harvesting in a plant antenna protein. Science 320: 794–797 - PubMed
    1. Allen J.F. (1992). Protein phosphorylation in regulation of photosynthesis. Biochim. Biophys. Acta 1098: 275–335 - PubMed
    1. Allen J.F. (2003). Botany. State transitions—A question of balance. Science 299: 1530–1532 - PubMed
    1. Austin J.R., II, Staehelin L.A. (2011). Three-dimensional architecture of grana and stroma thylakoids of higher plants as determined by electron tomography. Plant Physiol. 155: 1601–1611 - PMC - PubMed
    1. Barros T., Kuhlbrandt W. (2009). Crystallisation, structure and function of plant light-harvesting complex II. Biochim. Biophys. Acta Bioenerg. 1787: 753–772 - PubMed

Publication types

MeSH terms

Associated data

LinkOut - more resources