. 2013 Jun;25(6):2276-301.
doi: 10.1105/tpc.113.112557. Epub 2013 Jun 28.

ClpS1 is a conserved substrate selector for the chloroplast Clp protease system in Arabidopsis

Affiliations

ClpS1 is a conserved substrate selector for the chloroplast Clp protease system in Arabidopsis

Kenji Nishimura et al. Plant Cell. 2013 Jun.

Abstract

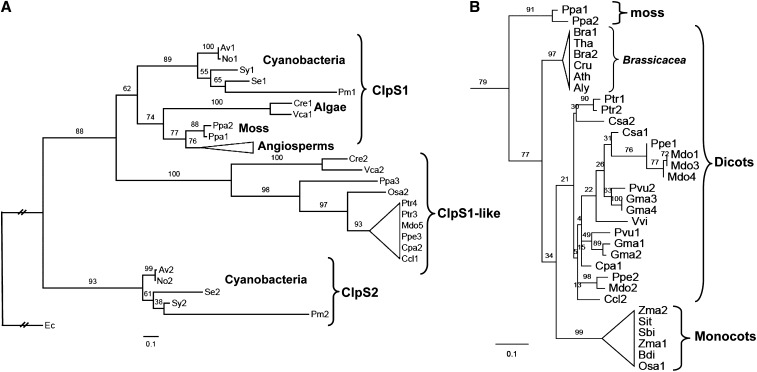
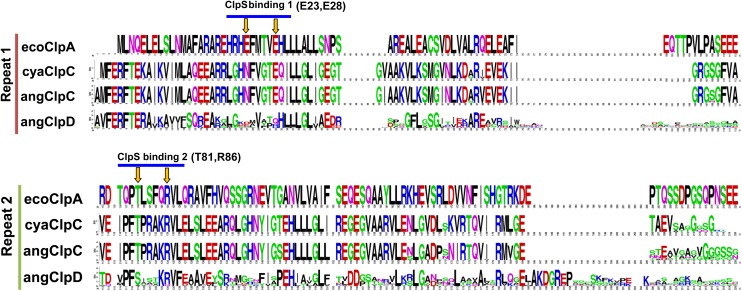
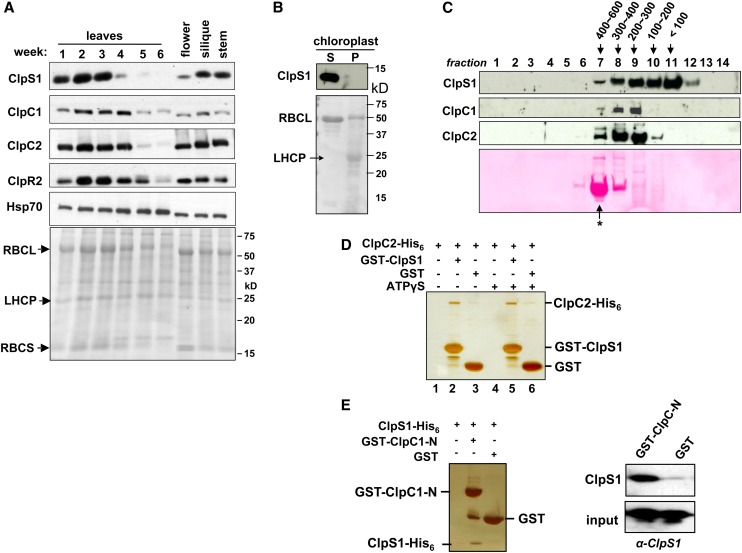
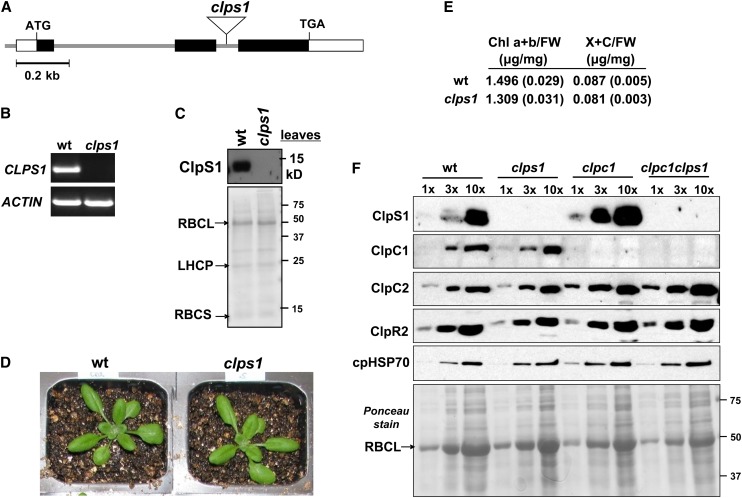
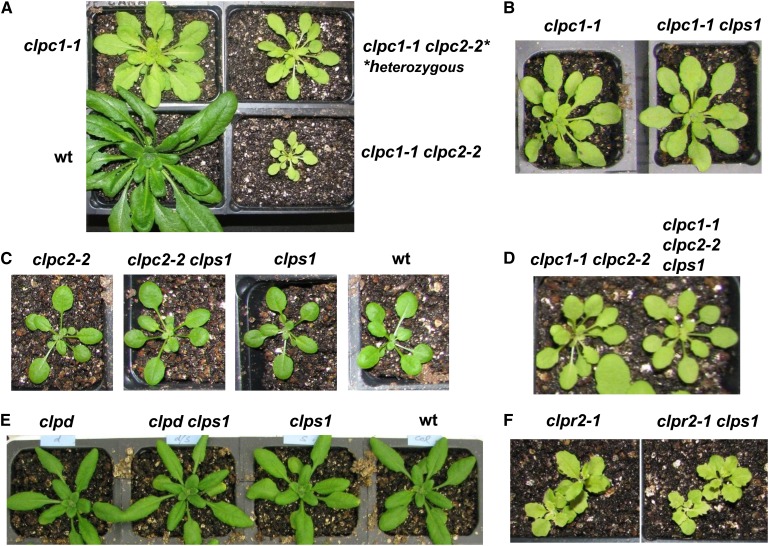
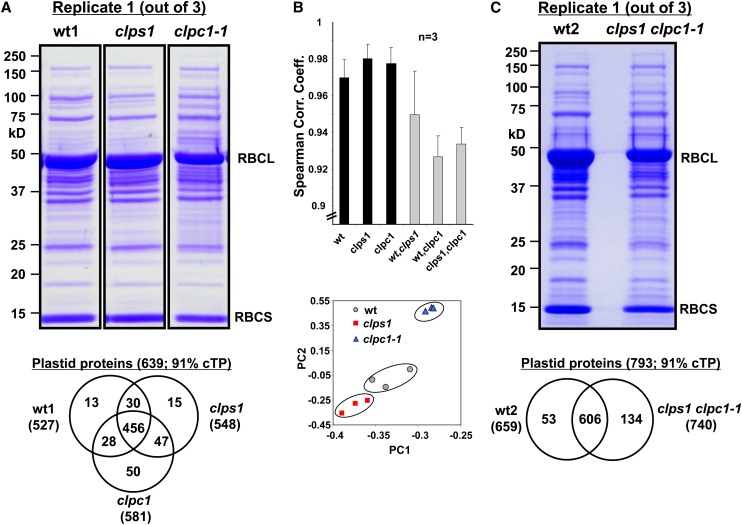
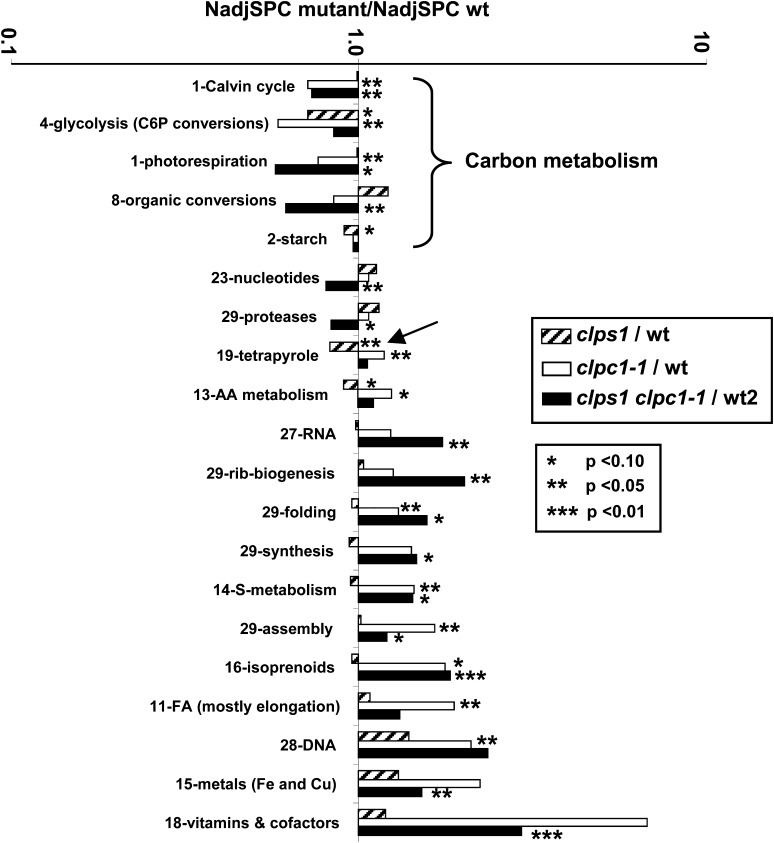
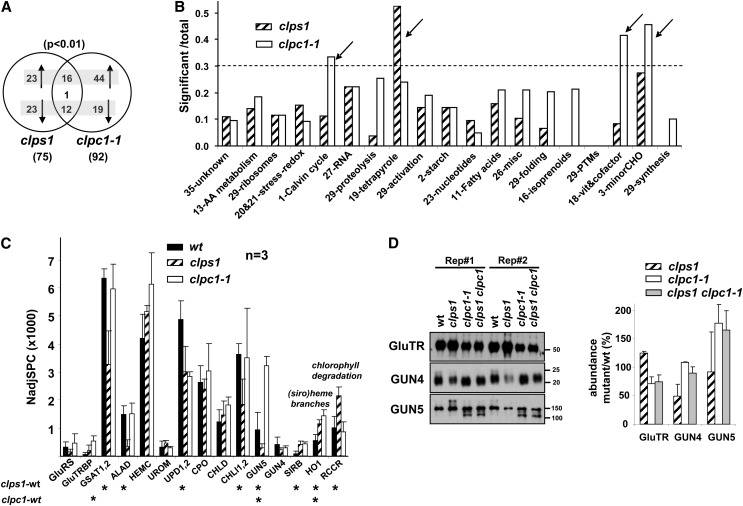
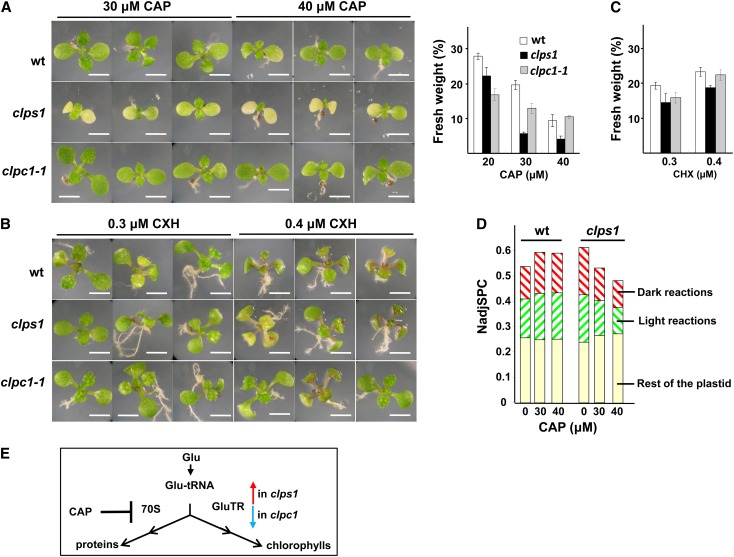
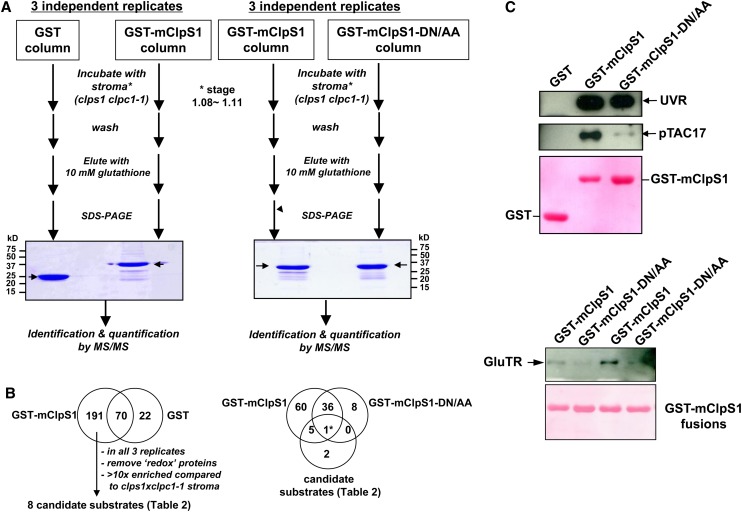
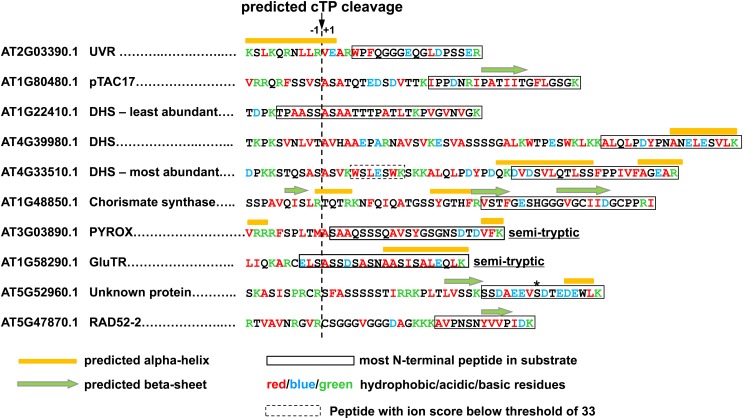
Whereas the plastid caseinolytic peptidase (Clp) P protease system is essential for plant development, substrates and substrate selection mechanisms are unknown. Bacterial ClpS is involved in N-degron substrate selection and delivery to the ClpAP protease. Through phylogenetic analysis, we show that all angiosperms contain ClpS1 and some species also contain ClpS1-like protein(s). In silico analysis suggests that ClpS1 is the functional homolog of bacterial ClpS. We show that Arabidopsis thaliana ClpS1 interacts with plastid ClpC1,2 chaperones. The Arabidopsis ClpS1 null mutant (clps1) lacks a visible phenotype, and no genetic interactions with ClpC/D chaperone or ClpPR core mutants were observed. However, clps1, but not clpc1-1, has increased sensitivity to the translational elongation inhibitor chloramphenicol suggesting a link between translational capacity and ClpS1. Moreover, ClpS1 was upregulated in clpc1-1, and quantitative proteomics of clps1, clpc1, and clps1 clpc1 showed specific molecular phenotypes attributed to loss of ClpC1 or ClpS1. In particular, clps1 showed alteration of the tetrapyrrole pathway. Affinity purification identified eight candidate ClpS1 substrates, including plastid DNA repair proteins and Glu tRNA reductase, which is a control point for tetrapyrrole synthesis. ClpS1 interaction with five substrates strictly depended on two conserved ClpS1 residues involved in N-degron recognition. ClpS1 function, substrates, and substrate recognition mechanisms are discussed.


Figures

Figure 1.
Figure 1.
Phylogenetic Analysis of ClpS. (A) Schematic Randomized Axelerated Maximum Likelihood (RAxML) phylogeny of 57 ClpS proteins from E. coli, five cyanobacterial species, twp algal species, moss, and 19 angiosperms. RAxML bootstrap support values are shown at the nodes of the tree, in which the E. coli ClpS is designated as the outgroup and ClpS relatives are classified into six clades: ClpS1 proteins from cyanobacteria, algae, moss, and angiosperms, ClpS2 protein from cyanobacteria, and ClpS1-like protein. ClpS1 and ClpS1-like proteins (39 in total) in angiosperms are collapsed and indicated as a triangle. Details for this angiosperm clade are shown in (B). The complete sequence alignment is shown in Supplemental Figure 1 online (excluding the cTPs) and is available as Supplemental Data Set 1 online. The species included are Physcomitrella patens (Ppa), Chlamydomonas reinhardtii (Cre), Volvox carteri (Vca), Anabaena variabilis ATCC 29413 (Av), Nostoc sp PCC 7120 (No), Synechocystis sp PCC 6803 (Sy), Synechococcus elongatus PCC 7942 (Se), Prochlorococcus marinus subsp marinus str. CCMP1375 (Pm), Escherichia coli str. K12 substr. W3110 (Ec). The 19 angiosperm species included are the 14 dicotyledons Populus trichocarpa (Ptr), Phaseolus vulgaris (Pvu), Glycine max (Gma), Cucumis sativus (Csa), Prunus persica (Ppe), Malus domestica (Mdo), Arabidopsis thaliana (Ath), Arabidopsis lyrata (Aly), Capsella rubella (Cru), Brassica rapa (Bra), Thellungiella halophila (Tha), Carica papaya (Cpa), Citrus clementina (Ccl), Vitis vinifera (Vvi), and the five monocotyledons Sorghum bicolor (Sbi), Zea mays (Zma), Setaria italica (Sit), Oryza sativa (Osa), and Brachypodium distachyon (Bdi). Distance is indicated as substitutions per site. (B) Phylogeny of the ClpS1 clade for the angiosperms and moss. ClpS1 proteins in Brassicaceae are separated in a single clade distinct from the others, including those in monocots. Distance is indicated as substitution rate per site.
Figure 2.
Figure 2.
Sequence Conservation of ClpS Proteins in the Angiosperms and Comparison to Bacterial ClpS Proteins. (A) Sequence logo showing sequence conservation of the N-terminal extensions of ClpS1 (angClpS1; 31 proteins) and ClpS1-like proteins (11 proteins) in the angiosperms and comparison to E. coli ClpS (EcClpS). (B) Sequence logo indicating sequence conservation of the ClpS core region for ClpS1 in the cyanobacteria (cyaClpS1), ClpS1 in the angiosperms (angClpS1), ClpS1-like in the angiosperms (ClpS1-like), and ClpS2 in cyanobacteria (cyaClpS2). E. coli ClpS residues are marked that are known to be involved N-degron binding (in green), substrate specificity (in purple), or chaperone binding (in yellow). Asterisks indicate E. coli residues Asp-35 and Asp-36, which were mutated by Ninnis et al. (2009), resulting in loss of substrate interaction.
Figure 3.
Figure 3.
In Silico Analysis of the Clp Chaperone Interactions with ClpS. Sequence logo indicating sequence conservation of repeat 1 and repeat 2 of ClpC in cyanobacteria (cyaClpC), angiosperms (angClpC), and of ClpD in angiosperm (angClpD) and comparison to E. coli ClpA (ecoClpA). Residues known to be important for E. coli ClpA with ClpS are indicated.
Figure 4.
Figure 4.
Spatiotemporal Accumulation of ClpS1 and Interaction between ClpS1 and ClpC Proteins. (A) Arabidopsis plants were grown on soil under continuous light. Leaves from the two outer rows of the rosette were harvested after 1 to 6 weeks. Flowers, siliques, and stems were collected after 6 weeks. Total proteins were extracted and analyzed by immunoblotting using anti-ClpS1, ClpC1/C2/R2, and cpHsp70 antibodies. Each lane contains 20 μg proteins, and the Ponceau-stained blot is shown as the loading control. Loss of RBCL during senescence (4 to 6 weeks) can be observed from the stained blot. (B) ClpS1 is exclusively located in the stroma and is absent in the chloroplast membranes. To determine the intraplastid location of ClpS1, chloroplasts were isolated from soil-grown wild-type. The stromal (S) and membrane fractions (P) were separated by centrifugation and analyzed by SDS-PAGE and immunoblotting. The filter was also stained with Ponceau S (bottom panel). (C) In vivo sizes of native ClpS1 and ClpC1/2 in the chloroplast stroma. Chloroplasts were isolated from soil-grown wild-type plants at leaf stage 1.07-1.08. The stromal proteins were prepared in the presence of ATPγS and separated using a Superose (gel filtration) column. The eluates were collected and pooled into 14 fractions. Proteins in each fraction were TCA precipitated, and equal volumes were analyzed by immunoblotting with antibodies against ClpS1, ClpC1, and ClpC2. The blot was also stained by Ponceau S, showing RBCL eluting as part of the 550-kD holocomplex (marked with an asterisk). (D) Direct interaction of ClpS1 with ClpC2. ClpC2-His6 protein was incubated with or without ATPγS and subsequently combined with GST-ClpS1 or ClpS. Proteins were bound to the GST affinity resin and then eluted with reduced glutathione. Eluates were analyzed by SDS-PAGE and silver staining. (E) Recombinant his6-tagged ClpS1 was incubated with recombinant GST or the N-domain of ClpC1 fused to GST. Proteins were bound to the GST affinity resin and then eluted with laemmli buffer. Eluates were analyzed by SDS-PAGE and silver staining, and ClpS1 was also detected by immunoblot with anti-ClpS1 antiserum. [See online article for color version of this figure.]
Figure 5.
Figure 5.
Analysis of a ClpS1 Null Mutant in Arabidopsis. (A) Gene model structure and position of T-DNA insertion in the CLPS1 null mutant used in this study. Exons (black boxes for coding sequence), 5′ and 3′ untranslated regions (open boxes), and T-DNA insertion (triangle) are indicated. (B) CLPS1 transcript accumulation in the wild type and clps1. Transcripts were extracted from wild-type and clps1 seedlings and amplified by RT-PCR with gene-specific primers and analyzed on an agarose gel. ACTIN mRNA was used as an internal control. (C) To determine if ClpS1 was absent in clps1, total leaf protein extracts from the wild type and clps1 were analyzed by SDS-PAGE and immunoblotting. The filter was also stained with Ponceau S (bottom panel). (D) Comparison of wild-type (wt) and clps1 phenotypes. Plants were grown for 20 d on soil under 16/8-h light/dark cycle at ∼120 µmol photons m−2 s−1. No visible differences were observed. (E) Pigment accumulation in soil-grown wild-type and clps1 seedlings at developmental stage 1.07. Plants were grown under a 10-h-light/14-h-dark period at ∼100 μmol photons m−1 s−2. Chlorophyll a+b (Chl a+b) and total xanthophyll and other carotenoid (X+C) contents were determined on a fresh weight basis; n = 6. se is indicated. (F) Upregulation of ClpS1 and ClpC2 proteins in the clpc1-1 mutant background. Stromal proteins were isolated from wild-type, clps1, clpc1-1, and clps1 clpc1-1 seedlings and analyzed by immunoblotting with anti-ClpS1, ClpC1, ClpC2, ClpR2, and cpHSP70 antibodies. A titration of proteins was loaded for each genotype, as indicated. The filter was stained with Ponceau S (bottom panel). [See online article for color version of this figure.]
Figure 6.
Figure 6.
Genetic Interactions of clps1 with other clp Mutants. (A) Dosage effect of clpc2 on clpc1. clpc1-1 plants were crossed with clpc2-2, and progenies with homozygous clpc1-1 and either homozygous or heterozygous clpc2-2 are shown. Plants were grown for 45 d under 10/14-h light/dark cycle at 120 µmol photons m−2 s−1. We note that the reciprocal dosage effect was not observed (data not shown). wt, the wild type. (B) Effect of clps1 on clpc1-1. Homozygous single and double mutant plants were grown for 37 d under 10/14-h light/dark cycle at 250 µmol photons m−2 s−1. No visible differences were observed. (C) Effect of clps1 on clpc2-2. Homozygous single and double mutant plants and the wild type were grown on soil for 23 d under 10/14-h light/dark cycle at 120 µmol photons m−2 s−1. No visible differences were observed. (D) Effect of clps1 on clpc1 clpc2. clpc1-1 clpc2-2 homozygous plants were crossed with clps1. Growth and development are shown for the resulting homozygous double and triple mutants grown for 45 d under 10/14-h light/dark cycle at 120 µmol photons m−2 s−1. No visible differences were observed. (E) Effect of clps1 on clpd. Homozygous single and double mutants as well as wild-type plants were grown for 23 d on soil under 16/8-h light/dark cycle at 120 µmol photons m−2 s−1. No visible differences were observed. (F) Effect of clps1 on clpr2-1. Homozygous single and double mutants were grown for 25 d on soil under 16/8-h light/dark cycle at 120 µmol photons m−2 s−1. No visible differences were observed.
Figure 7.
Figure 7.
Comparative Proteomics of the Wild Type, clps1, clpc1-1, and clps1 clpc1-1. (A) Representative Coomassie blue–stained SDS-PAGE gel image of stromal proteins from the wild type (wt), clps1, and clpc1-1. RBCL and RBCS accumulation levels are visibly reduced in clpc1-1. Each gel lane was cut in 10 slices and subjected to in-gel trypsin digestion and MS. The Venn diagram compares plastid proteins identified in wild-type, clps1, and clpc1-1 leaves. (B) Spearman correlation and PCA of the quantified proteomes of the wild type, clps1, and clpc1-1 are shown. The symbols in the PCA plot represent each of the biological replicates for each of the three genotypes. Error bars show the sd. (C) Coomassie blue–stained SDS-PAGE gel image of chloroplast stroma from wild-type and clps1 clpc1-1 plants. RBCL and RBCS accumulation levels are visibly reduced in clps1 clpc1-1. The Venn diagram summarizes the identified proteins in the wild type and double mutant. Spearman correlation and PCA analyses are shown in Supplemental Figure 5 online. [See online article for color version of this figure.]
Figure 8.
Figure 8.
Protein Mass Investment in Specific Plastid Functions in the Wild Type, clps1, clpc1-1, and clps1 clpc1-1. Functions that were significantly over- or underrepresented in the mutants are marked with asterisks. Three levels of significance are distinguished (P < 0.1, P < 0.05, or P < 0.01) and were determined using a Student’s t test (matched-paired samples). The arrow highlights the reduced investments in tetrapyrrole metabolism in clps1 compared with the wild type. C6P, hexose phosphates; AA, amino acid; FA, fatty acids; wt, the wild type.
Figure 9.
Figure 9.
Proteins Significantly Up- or Downregulated in the Mutant Alleles. (A) Venn diagram showing differentially (P < 0.01; determined by GLEE algorithm) expressed proteins in clps1 and clpc1-1. Upregulated and downregulated proteins are indicated with arrows. Only one protein, GUN5, showed opposite behavior between the two mutants. (B) Overrepresentation analysis of chloroplast functions in the stromal proteomes, based on the number of significantly (P < 0.01; determined by GLEE algorithm) differentially accumulating proteins normalized to the number of proteins identified in each function. Functions marked with an arrow appear overrepresented. Only functions with 10 or more identified proteins are shown. Functions are ranked from high (left) to low (right) number of identified proteins (e.g., 35, unknown has the most proteins, 73; 29, synthesis has the least proteins, 10). (C) Effect of loss of ClpS1 or ClpC1 on the tetrapyrrole pathway based on stromal proteome analysis. GluRS, Glu-tRNA synthase; PGR7, GluTR binding protein ; GSA1,2, Glu-1-semialdehyde 2,1-aminomutase 1,2; ALAD, porphobilinogen synthase-1 (δ-aminolevulinic acid dehydratase-1); HEMC, hydroxymethylbilane synthase; UROM, uroporphyrinogen-III synthase; UPD1,2, uroporphyrinogen decarboxylase 1,2; CPO, coproporphyrinogen III oxidase; CHLD, Mg-protoporphyrin IX chelatase D; CHLI1,2, Mg-protoporphyrin IX chelatase 1,2; GUN5, Mg-protoporphyrin IX chelatase H; SIRB, sirohydrochlorin ferrochelase; HO1, heme oxygenase 1; RCCR, red chlorophyll catabolite reductase. wt, the wild type. Error bars show the sd. (D) Immunoblot analysis of proteins in the tetrapyrrole pathway using total leaf extracts from the wild type, clps1, and clpc1-1. Equal amounts of proteins were loaded. Error bars show the sd.
Figure 10.
Figure 10.
Effects of Translation Inhibitors on clps1, clpc1-1, and the Wild Type. (A) and (B) Seedling phenotypes after treatment with CAP or CHX. Representative visible phenotypes of wild-type (wt), clps1, and clpc1-1 plants grown for 20 d under short days on half-strength Murashige and Skoog medium containing 2% Suc and CAP or CHX. Bars = 5 mm. (C) Effect of antibiotic treatments on fresh weight of wild-type and clps1 seedlings. Plants were grown for 21 d on agar plates containing 20, 30, or 40 μM CAP (left-hand panel) or 0.3 and 0.4 μM CHX (right-hand panel). Error bars show the sd. (D) Effect of CAP treatment on investments in the plastid proteome. Total cellular proteins were extracted from wild-type and clps1 seedlings after growth on 0, 30, or 40 μM CAP. The proteomes were loaded on a SDS-PAGE gels and proteins identified and quantified by MS/MS analysis after in-gel tryptic digestion. Total NadjSPC were calculated for all identified plastid proteins, for proteins involved in the Calvin cycle and proteins that are part of the thylakoid photosynthetic electron transport chain. (E) Effect of CAP and the clps1 and clpc1 null mutants on the branch point for Glu-tRNA utilization. 70S, plastid 70S ribosomes.
Figure 11.
Figure 11.
Identification of Candidate ClpS1 Substrates by Affinity Chromatography. (A) The workflow for the ClpS1 affinity purification and subsequent MS-based protein identification of ClpS1 substrate candidates. Representative gel images of pull-down eluates using wild-type and mutant (DN/AA) versions of GST-ClpS1 fusions, or the negative control GST, as bait proteins. The arrow indicates eluted GST or GST-ClpS1 (bait). Some of the visible bands represent breakdown products of recombinant GST or GST-ClpS1. (B) The workflow used to choose candidate ClpS1 substrates. The Venn diagram on the left shows those proteins identified using either GST or GST-ClpS1 as bait. From the 191 proteins only identified in the GST-ClpS1 affinity experiments, we considered only those candidate substrates that were observed in all three independent replicates that were also at least 10-fold enriched compared with the stroma of clps1 clpc1-1. Moreover, proteins with glutathione binding domains or thioredoxins were removed. The resulting eight candidate substrates were then compared with the proteins identified in a separate set of GST-ClpS1 and GST-ClpS1-DN/AA affinity assays as indicated in the Venn diagram on the right. Details of the candidate substrate proteins can be found in Table 2. (C) Confirmation of ClpS1 interactions by immunoblotting. Eluates were transferred to blots and probed with antisera raised against pTAC17, the UVR protein, or GluTR. Ponceau stains of the blots are shown and visualize the recombinant bait. [See online article for color version of this figure.]
Figure 12.
Figure 12.
Primary Sequences, Predicted Secondary Structure, and Experimental Information about the N-Terminal Regions of the Candidate ClpS1 Substrates. Because each of the substrates have predicted N-terminal chloroplast transit peptides that are removed after import into the chloroplast, we used the predicted cTP processing site (by TargetP) and mapped the peptides identified by MS in the eluates from GST-ClpS affinity purifications onto the sequences. The asterisk indicates a phosphorylation site.

Similar articles

Cited by

References

    1. Apel W., Schulze W.X., Bock R. (2010). Identification of protein stability determinants in chloroplasts. Plant J. 63: 636–650 - PMC - PubMed
    1. Asakura Y., Galarneau E.R., Watkins K.P., Barkan A., van Wijk K.J. (2012). Chloroplast RH3 DEAD box RNA helicases in maize and Arabidopsis function in splicing of specific group II introns and affect chloroplast ribosome biogenesis. Plant Physiol. 159: 961–974 - PMC - PubMed
    1. Baker T.A., Sauer R.T. (2012). ClpXP, an ATP-powered unfolding and protein-degradation machine. Biochim. Biophys. Acta 1823: 15–28 - PMC - PubMed
    1. Bischof S., Baerenfaller K., Wildhaber T., Troesch R., Vidi P.A., Roschitzki B., Hirsch-Hoffmann M., Hennig L., Kessler F., Gruissem W., Baginsky S. (2011). Plastid proteome assembly without Toc159: Photosynthetic protein import and accumulation of N-acetylated plastid precursor proteins. Plant Cell 23: 3911–3928 - PMC - PubMed
    1. Bruch E.M., Rosano G.L., Ceccarelli E.A. (2012). Chloroplastic Hsp100 chaperones ClpC2 and ClpD interact in vitro with a transit peptide only when it is located at the N-terminus of a protein. BMC Plant Biol. 12: 57. - PMC - PubMed

MeSH terms