. 2013 Jun;25(6):2356-78.
doi: 10.1105/tpc.112.103499. Epub 2013 Jun 28.

Infection structure-specific expression of β-1,3-glucan synthase is essential for pathogenicity of Colletotrichum graminicola and evasion of β-glucan-triggered immunity in maize

Affiliations

Infection structure-specific expression of β-1,3-glucan synthase is essential for pathogenicity of Colletotrichum graminicola and evasion of β-glucan-triggered immunity in maize

Ely Oliveira-Garcia et al. Plant Cell. 2013 Jun.

Abstract

β-1,3-Glucan and chitin are the most prominent polysaccharides of the fungal cell wall. Covalently linked, these polymers form a scaffold that determines the form and properties of vegetative and pathogenic hyphae. While the role of chitin in plant infection is well understood, the role of β-1,3-glucan is unknown. We functionally characterized the β-1,3-glucan synthase gene GLS1 of the maize (Zea mays) pathogen Colletotrichum graminicola, employing RNA interference (RNAi), GLS1 overexpression, live-cell imaging, and aniline blue fluorochrome staining. This hemibiotroph sequentially differentiates a melanized appressorium on the cuticle and biotrophic and necrotrophic hyphae in its host. Massive β-1,3-glucan contents were detected in cell walls of appressoria and necrotrophic hyphae. Unexpectedly, GLS1 expression and β-1,3-glucan contents were drastically reduced during biotrophic development. In appressoria of RNAi strains, downregulation of β-1,3-glucan synthesis increased cell wall elasticity, and the appressoria exploded. While the shape of biotrophic hyphae was unaffected in RNAi strains, necrotrophic hyphae showed severe distortions. Constitutive expression of GLS1 led to exposure of β-1,3-glucan on biotrophic hyphae, massive induction of broad-spectrum defense responses, and significantly reduced disease symptom severity. Thus, while β-1,3-glucan synthesis is required for cell wall rigidity in appressoria and fast-growing necrotrophic hyphae, its rigorous downregulation during biotrophic development represents a strategy for evading β-glucan-triggered immunity.


Figures
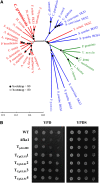
Figure 1.
Figure 1.
GLS1 of C. graminicola Encodes a Functional GLS. (A) Phylogenetic tree indicates close relatedness of GLS1 of C. graminicola with other GLSs of filamentous fungi: A. capsulatus, Ajellomyces capsulatus; A. dermattidis, Ajellomyces dermatitidis; A. flavus, Aspergillus flavus; A. oryzae, Aspergillus oryzae; A. fumigatus, Aspergillus fumigatus; A. nidulans, Aspergillus nidulans; C. albicans, Candida albicans; C. glabrata, Candida glabrata; C. paraplosis, Candida parapsilosis; C. gattii, Cryptococcus gattii; C. immitis, Coccidioides immitis; C. posadasii, Coccidioides posadasii; C. graminicola, Colletotrichum graminicola; C. cinerea, Coprinopsis cinerea; C. neoformans, Cryptococcus neoformans; E. dermatitis, Exophiala dermatitidis; F. solani (FKS1), Fusarium solani (ABC59463); F. solani (FKS2), Fusarium solani (XP003040299.1); L. bicolor, Laccaria bicolor; M. oryzae, Magnaporthe oryzae; M. acridum, Metarhizium acridum; N. crassa, Neurospora crassa; P. brasiliensis, Paracoccidioides brasiliensis; P. marneffei, Penicillium marneffei; P. pastoris, Pichia pastoris; P. graminis, Puccinia graminis f. sp tritici; S. cerevisiae (FKS1), Saccharomyces cerevisiae; S. cerevisiae (FKS2), Saccharomyces cerevisiae; S. cerevisiae (FKS3), Saccharomyces cerevisiae; S. pombe (Bgs1), Schizosaccharomyces pombe; S. pombe, Schizosaccharomyces pombe (Bgs2); S. pombae (Bgs3), Schizosaccharomyces pombe (NP594766.1); S. pombae (Bgs4), Schizosaccharomyces pombe; S. sclerotiorum, Sclerotinia sclerotiorum; T. stipitatus, Talaromyces stipitatus; U. maydis, Ustilago maydis; and Z. rouxii, Zygosaccharomyces rouxii. Red, filamentous Ascomycota; blue, unicellular Ascomycota (yeasts); green, Basidiomycota. (B) Complementation of S. cerevisiae Δfks1 by GLS1 cDNA of C. graminicola suggests that GLS1 encodes an active GLS. WT, S. cerevisiae reference strain Y00000; Δfks1, FKS1-deficient S. cerevisiae strain Y05251; TpAG300, Δfks1 transformant harboring the empty binary vector pAG300; TCgGLS11 - 4, independent Δfks1 transformants expressing the GLS1 cDNA of C. graminicola; YPD, YPD medium; YPDS, YPD medium supplemented with 1 M sorbitol. Number of yeast cells inoculated were (left to right) 5 × 10⁴, 5 × 10³, 5 × 10², and 5 × 10.
Figure 2.
Figure 2.
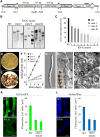
RNAi-Mediated Reduction of GLS1 Transcript Abundance Causes Reduction of β-1,3-Glucan Contents of Cell Walls, Hyphal Distortion, and Retarded Growth. (A) RNAi construct transformed into C. graminicola. Bar indicates probe used for DNA gel blots. PtrpC, trpC promoter; TtrpC, trpC terminator, Nat-1, Nourseothricin acetyl transferase gene. Not to scale. (B) DNA gel blot of XhoI-digested genomic DNA of C. graminicola wild-type (WT) and RNAi strains. A digoxygenin-labeled fragment of the Nat-1 gene served as the probe (bar in Figure 3A). (C) GLS1 transcript abundance measured by qRT-PCR. Means of four replicate are shown. Bars represent ±sd. (D) and (E) Morphology of colonies of the wild type (D) and a class I RNAi strain (E) on OMA supplemented with 0.15 M KCl. (F) Radial growth of wild-type, class I, class II, and class III RNAi strains on OMA supplemented with 0.15 M KCl. Means of four replicates are shown. Bars represent ±sd. (G) Vegetative hypha of the wild-type strain. (H) Vegetative hypha of a class I RNAi strain showing hyphal swellings (arrowheads). Inset shows pigmentation of swellings. (J) Severely distorted vegetative hyphae of a class II RNAi strain. Even on OMA supplemented with 0.15 M KCl the mycelium consists of swellings (asterisks), some of which are strongly melanized (arrow). Bars in (G) to (J) = 5 µm. (K) eGFP fluorescence and quantification of fluorescence intensities in the wild type and a class I RNAi strain carrying a GLS1:eGFP replacement construct. (L) β-1,3-Glucan distribution and quantification of fluorescence in a wild type and a class I RNAi strain carrying a GLS1:eGFP replacement construct. Hyphae were stained by aniline blue fluorochrome. Bars in micrographs in (K) and (L) = 10 µm. Three times 100 cells were measured bars on columns represent ±sd.
Figure 3.
Figure 3.
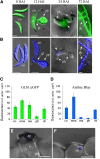
Infection Structure–Specific Expression of GLS1:eGFP and Synthesis of β-1,3-Glucan in C. graminicola. (A) GLS1:eGFP is strongly expressed in conidia (co; 0 HAI), appressorium (ap; 12 HAI), and necrotrophic secondary hyphae (sh; 72 HAI) but not in biotrophic primary hyphae (ph; 24 HAI). (B) Staining of infection structures with β-1,3-glucan–specific aniline blue fluorochrome shows β-1,3-glucan in conidia (co; 0 HAI), appressorium (ap; 12 HAI), and necrotrophic secondary hyphae (sh; 72 HAI), but not in biotrophic primary hyphae (ph; 24 HAI). Bars (A) and (B) = 10 µm. (C) Quantification of eGFP fluorescence in infection structures. co, conidia; gt, germ tubes; nma, nonmelanized appressoria; ma, melanized appressoria; ph, biotrophic primary hyphae; sh, necrotrophic secondary hyphae. Three times 100 infection structures were measured. (D) Quantification of β-1,3-glucan in infection structures using aniline blue fluorochrome. co, condia; gt, germ tubes; nma, nonmelanized appressoria; ma, melanized appressoria; ph, biotrophic primary hyphae; sh, necrotrophic secondary hyphae. Three times 100 infection structures were measured. Bars in (C) and (D) represent ±sd. (E) and (F) Aniline blue fluorochrome labeling of biotrophic (E) and necrotrophic (F) hyphae. ap, appressorium; iv, infection vesicle; ph, primary hypha; sh, secondary hypha. Bars = 20 µm.
Figure 4.
Figure 4.
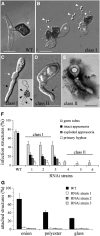
Appressoria of RNAi Strains of C. graminicola Lack Cell Wall Rigidity, Have Melanization Defects, and Are Nonadhesive. (A) On polyester, conidia (asterisk) the wild-type (WT) strain germinate and form melanized appressoria (arrow). (B) Conidia (asterisk) of class I RNAi strains germinate and form appressoria, many of which explode (arrow) and release lipid bodies (arrowhead). (C) Appressorium (white arrow) of a class I RNAi strain with a voluminous hypha (black arrow) reminiscent of a primary hypha. Inset shows an irregularly melanized appressorium surrounded by a ring of melanin (arrowheads). A hypha with large diameter reminiscent of a primary hypha is marked by a black arrow. (D) Conidia (asterisk) of class II RNAi strains are able to form germ tubes (arrow) but fail to differentiate appressoria. (E) Germling of a class II strain surrounded by a melanin precipitate. Bars in (A) to (E) = 10 µm. (F) Quantification of infection structure differentiation on polyester. In each of the three independent experiments performed, 100 infection structures were counted. (G) Adhesion of infection structures formed by wild-type and three independent class I RNAi strains on onion epidermis or artificial surfaces 24 HAI. In each of the three independent experiments performed, 100 infection structures were counted. Bars in (F) and (G) represent sd.
Figure 5.
Figure 5.
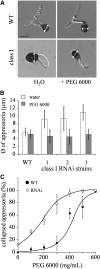
Downregulation of Appressorial β-1,3-Glucan Contents Increases Cell Wall Elasticity and Reduces Turgor Pressure. (A) Appressoria of the wild-type (WT) strain show comparable sizes in water and in the osmolyte PEG 6000 (400 mg/mL), as indicated by the double arrow. Appressoria of class I RNAi strains had larger diameters in water than in PEG 6000. Bar = 10 µm. (B) Quantification of appressorial diameters of the wild type and three class I RNAi strains in water and after addition of PEG 6000 (400 mg/mL). Three times 100 appressoria were measured. (C) Incipient cytorrhizis indicates that the appressorial turgor pressure of class I RNAi strains is considerably lower than that of the wild-type strain. Three times 100 appressoria were counted. Bars in (B) and (C) represent ±sd.
Figure 6.
Figure 6.
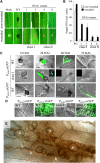
RNAi Strains of C. graminicola Form Severely Distorted Necrotrophic Hyphae and Are Nonpathogenic on Maize. (A) Disease symptoms on wounded and nonwounded maize leaves after inoculation with the wild type (WT) and independent class I (1 and 3) and class II RNAi strains (4 and 6). Mock-inoculated leaves were treated with 0.01% (v/v) Tween 20. (B) Quantification of fungal development on intact or wounded maize leaves after inoculation with the strains used in (A). Three biological repeats, with two technical repeats each, were analyzed; bars represent sd. (C) Development of infection structures of the wild type and a class I RNAi strain expressing the eGFP gene under the control of the biotrophy-specific SDH promoter (PSDH) and of the wild-type strain expressing the eGFP gene under the control of the necrotrophy-specific SPEP promoter (PSPEP) on intact maize leaves. ap, appressorium; co, conidium; ph, primary hypha; sh, secondary hypha. Insets in class I, 24 to 72 HAI show viability staining with fluorescein diacetate. (D) Development of infection structures of the wild type and a class I RNAi strain on wounded maize leaves. eGFP gene expression is under control of the biotrophy-specific SDH (PSDH) or the necrotrophy-specific SPEP promoter (PSPEP). (E) Necrotrophic hyphae of a class I RNAi strain in a maize leaf after wound inoculation. Hyphae show severe swellings (asterisks), connected by narrow hyphae (arrowheads). Arrow indicates penetration point in an anticlinal plant cell wall. Bar in (C) to (E) = 10 µm.
Figure 7.
Figure 7.
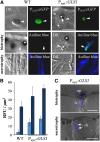
Forced Expression of GLS1 in Biotrophic Hyphae of C. graminicola Affects Hyphal Morphology. (A) Comparison of biotrophic infection vesicles (top panel, arrowhead) formed by the wild-type (WT) strain and strains harboring an ectopically integrated GLS1 copy controlled by PtrpC indicated that forced expression of GLS1 led to reduction of hyphal diameters. Both wild-type and PtrpC:GLS1 strains carried a PSDH:eGFP construct confirming biotrophic lifestyle of fluorescing structures. While aniline blue fluorescence indicated that β-1,3-glucan was present in biotrophic hyphae of the PtrpC:GLS1 strain (biotrophy; aniline blue; PtrpC:GLS1; arrowhead), no fluorescence was visible in the wild-type strain (biotrophy; aniline blue; WT; arrowhead). Necrotrophic hyphae of both the wild type and PtrpC:GLS1 strain showed aniline blue fluorescence (necrotrophy; aniline blue; WT and PtrpC:GLS1; arrowhead). DIC, differential interference contrast micrographs. Bars = 20 µm. (B) Quantification of aniline blue fluorescence in biotrophic (light blue) and necrotrophic hyphae (dark blue) of the wild type and two independent PtrpC:GLS1 strains. Three times 100 measurements were performed with each strain; bars are ±sd. RFU, relative fluorescence units. (C) Staining of cross sections of biotrophic and necrotrophic hyphae of the PtrpC:GLS1 strain with aniline blue fluorochrome. ap, appressorium; iv, infection vesicle; sh, secondary hyphae. Bars = 20 µm.
Figure 8.
Figure 8.
Forced Expression of GLS1 in Biotrophic Hyphae of C. graminicola Induces Defense Responses in Maize and Causes Reduced Fungal Virulence. (A) Disease symptoms on nonwounded maize leaves after inoculation with the wild-type (WT) strain, two independent strains harboring a single ectopically integrated extra copy of GLS1 controlled by the trpC or toxB promoter of A. nidulans or P. tritici-repentis, respectively (ectopic, PtrpC:GLS; PtoxB:GLS), and strains with the GLS1 promoter exchanged by the trpC or toxB promoter (promoter exchange, PtrpC:GLS; PtoxB:GLS). Mock-inoculated leaves were treated with 0.01% (v/v) Tween 20. (B) Appressorial penetration rates of the wild-type strain, two independent strains harboring a single ectopically integrated extra copy of GLS1 controlled by the trpC or toxB promoter, respectively (ectopic, PtrpC:GLS; PtoxB:GLS), and strains with the GLS1 promoter exchanged by the trpC or toxB promoter (promoter exchange, PtrpC:GLS; PtoxB:GLS). (C) Quantification of fungal development on nonwounded (gray, WT; light blue, PtrpC:GLS; light green, PtoxB:GLS) and wounded maize leaves (black, WT; dark blue, PtrpC:GLS; dark green, PtoxB:GLS) by qPCR. Three independent measurements were performed for each strain in (B) and (C); bars are ±sd. (D) Disease symptoms on wounded maize leaves after inoculation with the wild-type strain or representative promoter exchange or ectopic PtrpC:GLS or PtoxB:GLS strains. Mock inoculated leaves were treated with 0.01% (v/v) Tween 20. (E) Both wild-type and PtrpC:GLS1 strains differentiated melanized appressoria (black arrowheads) and invaded intact maize leaves, but only the PtrpC:GLS1 strains caused whole-cell (white arrows) or cell wall fluorescence (white arrowheads) in maize under UV light, indicative of defense responses. Bars = 10 µm. (F) Quantification of fluorescing maize cells decorated with single appressoria of the wild type or PtrpC:GLS1 strains. Three times 100 cells were measured. Bars represent ±sd. (G) Maize cells infected by hyphae of PtrpC:GLS1 strains formed vesicles (arrowhead) that turned dark brown (insert) and densely decorated the invading hyphae (arrow). The wild-type strain formed hyphae (white arrow) rarely associated with vesicles. Bars = 10 µm.
Figure 9.
Figure 9.
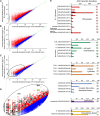
Analysis of the Transcriptional Response of Z. mays to Infection by C. graminicola Wild-Type and PtrpC:GLS1 Strains by Illumina mRNA Sequencing and qRT-PCR. (A) and (B) Comparison of transcript abundances of wild-type-infected (A) and PtrpC:GLS1-infected (B) leaves with that of noninfected controls. Red, transcript abundance of upregulated genes; blue, transcript abundance of downregulated genes. Changes are given on a log2 scale. (C) Comparison of transcript abundances of PtrpC:GLS1-infected with that of wild-type-infected leaves. Red, transcript abundance of upregulated genes; blue, transcript abundance of downregulated genes. WT, the wild type. (D) Magnification of the region encircled in (C). Transcripts of genes marked by black circles were quantified by qRT-PCR (E). Colors of numbers correspond to gene categories ([E]; see Supplemental Data Set 1 online). Green lines in (A) to (D) indicate identical transcript abundance levels under both conditions. (E) Quantification of transcripts putatively involved in defense responses. White, noninfected control leaves; black, wild-type-infected leaves; colors, leaves infected by PtrpC:GLS1 strains. Colors correspond to gene categories shown in Supplemental Data Set 1 online, and numbers correspond to those in (D). Error bars are standard deviations. Three independent repeats of infection assays were performed.
Figure 10.
Figure 10.
Model of Cell Wall Modifications in Infection Structures of C. graminicola. In appressoria (ap), cell walls consist of significant amounts of chitin (red circles), β-1,3-glucan (light-blue circles), and β-1,6-glucan (violet), forming a rigid scaffold, with melanin (mel) forming a layer in the vicinity of the fungal plasma membrane (fpm). Biotrophic infection vesicles (iv) and primary hyphae (ph; green) are located within the interfacial matrix and surrounded by the plant plasma membrane (ppm) containing β-glucan (gr) and chitin receptors (cr). The walls of these voluminous hyphae show no or very low amounts of β-1,3-glucan, and surface-localized chitin is deacetylated to yield chitosan (brown circles). Cell walls of thin secondary hyphae (sh; orange) exhibit chitin (red circles), chitosan (brown circles), β-1,3- (light-blue circles), and β-1,6-glucan (violet). These hyphae are highly destructive and cause necrosis of host cells.

Similar articles

Cited by

References

    1. Afzal A.J., Wood A.J., Lightfoot D.A. (2008). Plant receptor-like serine threonine kinases: Roles in signaling and plant defense. Mol. Plant Microbe Interact. 21: 507–517 - PubMed
    1. Aimanianda V., Bayry J., Bozza S., Kniemeyer O., Perruccio K., Elluru S.R., Clavaud C., Paris S., Brakhage A.A., Kaveri S.V., Romani L., Latgé J.-P. (2009). Surface hydrophobin prevents immune recognition of airborne fungal spores. Nature 460: 1117–1121 - PubMed
    1. Almagro L., Gómez Ros L.V., Belchi-Navarro S., Bru R., Ros Barceló A., Pedreño M.A. (2009). Class III peroxidases in plant defence reactions. J. Exp. Bot. 60: 377–390 - PubMed
    1. Andrie R.M., Martinez J.P., Ciuffetti L.M. (2005). Development of ToxA and ToxB promoter-driven fluorescent protein expression vectors for use in filamentous ascomycetes. Mycologia 97: 1152–1161 - PubMed
    1. Barber M.S., Bertram R.E., Ride J.P. (1989). Chitin oligosaccharides elicit lignification in wounded wheat leaves. Physiol. Mol. Plant Pathol. 34: 3–12

Publication types

MeSH terms

Associated data