Comparative Study
. 2013 Aug 13;110(33):13446-51.
doi: 10.1073/pnas.1312778110. Epub 2013 Jul 29.

Oxygen, ecology, and the Cambrian radiation of animals

Affiliations
Comparative Study

Oxygen, ecology, and the Cambrian radiation of animals

Erik A Sperling et al. Proc Natl Acad Sci U S A. .

Abstract

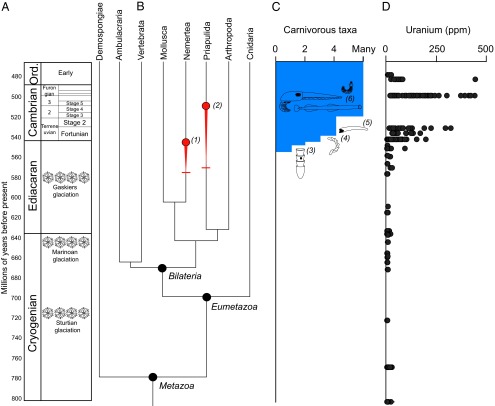
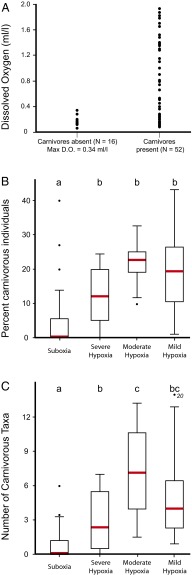
The Proterozoic-Cambrian transition records the appearance of essentially all animal body plans (phyla), yet to date no single hypothesis adequately explains both the timing of the event and the evident increase in diversity and disparity. Ecological triggers focused on escalatory predator-prey "arms races" can explain the evolutionary pattern but not its timing, whereas environmental triggers, particularly ocean/atmosphere oxygenation, do the reverse. Using modern oxygen minimum zones as an analog for Proterozoic oceans, we explore the effect of low oxygen levels on the feeding ecology of polychaetes, the dominant macrofaunal animals in deep-sea sediments. Here we show that low oxygen is clearly linked to low proportions of carnivores in a community and low diversity of carnivorous taxa, whereas higher oxygen levels support more complex food webs. The recognition of a physiological control on carnivory therefore links environmental triggers and ecological drivers, providing an integrated explanation for both the pattern and timing of Cambrian animal radiation.

Keywords: Ediacaran; Metazoa; evolution; hypoxia.


Conflict of interest statement

The authors declare no conflict of interest.

Figures

Fig. 1.
Fig. 1.
The temporal origins of carnivory in animals. (A) Geological time scale for the Cryogenian-Ordovician (Ord.). (B and C) Origins of carnivorous metazoans as inferred from the molecular (2, 23) and fossil records. In B, red horizontal whiskers represent maximum estimates for the evolution of carnivory in nemerteans and priapulids as constrained by molecular clock ages for their divergence from noncarnivorous sister groups. Red circles represent minimum ages for carnivory as constrained by the nemertean crown group (1), as all extant nemerteans are carnivores, and early Cambrian priapulid fossils (2) with gut contents indicating a carnivorous habit. Carnivory evolved between these minimum and maximum age estimates. In C, fossil evidence for carnivory around the Precambrian-Cambrian transition includes apparent drill holes in the fossil Cloudina (3); the trace fossil Treptichnus pedum, if it represents the burrowing activities of carnivorous priapulids (47) (4); and the widespread early Cambrian small shelly fossil Protohertzina, interpreted as grasping spines of chaetognaths (19) (5). By series 2 and 3 of the Cambrian, fossil Lagerstätten record numerous carnivores including a variety of arthropods, priapulids with hyolith gut contents, and chaetognath body fossils (6) (reviewed by ref. 21). (D) The origin of carnivory coincides with a major increase in the concentration of uranium and other redox-sensitive trace elements in organic-rich, fine-grained sedimentary rocks (data replotted from ref. 48). Higher values indicate higher seawater concentrations of U and more widespread oxygenation. Other redox proxies for this interval, including patterns similar to uranium for molybdenum and vanadium, are reviewed by refs. and .
Fig. 2.
Fig. 2.
Relationship between oxygen and carnivory in modern oxygen minimum zones. (A) Bottom-water oxygen concentrations at stations with carnivores present and absent. D.O., dissolved oxygen. (B and C) Standard box-and-whisker plots of percent carnivorous individuals (B) and number of carnivorous taxa (C) against four oxygen bins: suboxia (0–0.2 mL/L O2, or 0–9 µM; 26 stations), severe hypoxia (0.2–0.5 mL/L O2, or 9–22 µM; 13 stations), moderate hypoxia (0.5–1.0 mL/L O2, or 22–45 µM; 9 stations), and mild hypoxia (1.0–2.0 mL/L O2, or 45–89 µM; 20 stations). For box plots, the box encompasses the first and third quartiles, thick bar depicts the median, and whiskers depict true minimum and maximum values except where outliers (dots) greater than 1.5 times the interquartile range were identified. Means with the same lowercase letter at the top of the graph are not significantly different based on Tukey HSD test (α = 0.05). Outlier in mild hypoxia bin in C not to scale.

References

    1. Knoll AH, Carroll SB. Early animal evolution: Emerging views from comparative biology and geology. Science. 1999;284(5423):2129–2137. - PubMed
    1. Erwin DH, et al. The Cambrian conundrum: Early divergence and later ecological success in the early history of animals. Science. 2011;334(6059):1091–1097. - PubMed
    1. Cloud PE., Jr Atmospheric and hydrospheric evolution on the primitive earth. Both secular accretion and biological and geochemical processes have affected earth’s volatile envelope. Science. 1968;160(3829):729–736. - PubMed
    1. Rhoads DC, Morse JW. Evolutionary and ecologic significance of oxygen-deficient marine basins. Lethaia. 1971;4(4):413–428.
    1. Runnegar B. The Cambrian explosion: Animals or fossils? J Geol Soc Aust. 1982;29(3-4):395–411.

Publication types