. 2013 Jul 24:7:400.
doi: 10.3389/fnhum.2013.00400. eCollection 2013.

Imaging white matter in human brainstem

Affiliations

Imaging white matter in human brainstem

Anastasia A Ford et al. Front Hum Neurosci. .

Abstract

The human brainstem is critical for the control of many life-sustaining functions, such as consciousness, respiration, sleep, and transfer of sensory and motor information between the brain and the spinal cord. Most of our knowledge about structure and organization of white and gray matter within the brainstem is derived from ex vivo dissection and histology studies. However, these methods cannot be applied to study structural architecture in live human participants. Tractography from diffusion-weighted magnetic resonance imaging (MRI) may provide valuable insights about white matter organization within the brainstem in vivo. However, this method presents technical challenges in vivo due to susceptibility artifacts, functionally dense anatomy, as well as pulsatile and respiratory motion. To investigate the limits of MR tractography, we present results from high angular resolution diffusion imaging of an intact excised human brainstem performed at 11.1 T using isotropic resolution of 0.333, 1, and 2 mm, with the latter reflecting resolution currently used clinically. At the highest resolution, the dense fiber architecture of the brainstem is evident, but the definition of structures degrades as resolution decreases. In particular, the inferred corticopontine/corticospinal tracts (CPT/CST), superior (SCP) and middle cerebellar peduncle (MCP), and medial lemniscus (ML) pathways are clearly discernable and follow known anatomical trajectories at the highest spatial resolution. At lower resolutions, the CST/CPT, SCP, and MCP pathways are artificially enlarged due to inclusion of collinear and crossing fibers not inherent to these three pathways. The inferred ML pathways appear smaller at lower resolutions, indicating insufficient spatial information to successfully resolve smaller fiber pathways. Our results suggest that white matter tractography maps derived from the excised brainstem can be used to guide the study of the brainstem architecture using diffusion MRI in vivo.

Keywords: brainstem; diffusion-weighted imaging; high-resolution MRI; tractography; white matter.


Figures

Figure 1
Figure 1
Ex vivo tissue sample. (A) Coronal view displaying the anterior portion of the tissue sample. (B) Sagittal view displaying the left-hand side of the tissue sample.
Figure 2
Figure 2
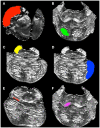
Regions of interest used to delineate white matter pathways within the brainstem. (A) cerebral peduncle mask, (B) inferior pons mask, (C) superior cerebellar peduncle (SCP) mask, (D) middle cerebellar peduncle mask (MCP), (E) superior medial lemniscus (ML) mask, and (F) inferior ML mask.
Figure 3
Figure 3
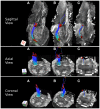
Corticopontine/corticospinal pathways: (A) 0.333 mm isotropic acquisition resolution, (B) 1 mm resolution, (C) 2 mm resolution. Top row: sagittal view of the pathways with a mid-sagittal slice of the FA maps serving as a background. Middle row: coronal view of the pathways with an axial slice of the FA maps serving as a background. Bottom row: axial view of the pathways with an axial slice of the FA maps serving as a background. Regions of interest used to delineate the pathways (cerebral peduncle and inferior pons) depicted in pink. The regions of interest are not included in the axial view images for ease of visualization of the pathways. Three-dimensional cubes to the right of the images represent spatial rotations of the pathways, where faces of the cubes represent orientations of the x, y, and z axes in space: R (right, x-axis), A (anterior, y-axis), S (superior, z-axis). Color gradient within the pathways represent local fiber orientation: red – medial/lateral; blue – superior/inferior; green – anterior/posterior.
Figure 4
Figure 4
Superior cerebellar peduncle pathways: (A) 0.333 mm isotropic acquisition resolution dataset, (B) 1 mm isotropic resolution dataset, (C) 2 mm isotropic resolution dataset. An axial slice of the FA maps serves as a background image. Superior cerebellar peduncle (SCP) and a waypoint mask are depicted in yellow. Color gradient and three-dimensional cube colors are the same as in Figure 3.
Figure 5
Figure 5
Middle cerebellar peduncle pathways: (A) 0.333 mm isotropic dataset, (B) 1 mm isotropic dataset, (C) 2 mm isotropic dataset. An axial slice of the FA maps serves as a background image. Middle cerebellar peduncle (MCP) and the waypoint (cerebral peduncle) mask are depicted in cyan color. Color gradient and three-dimensional cube colors are the same as in Figure 3.
Figure 6
Figure 6
Medial lemniscus pathways: (A) 0.333 mm isotropic acquisition resolution dataset, (B) 1 mm isotropic resolution dataset, (C) 2 mm isotropic resolution dataset. An axial slice of the FA maps serves as a background image. Superior and inferior medial lemniscus (ML) regions of interest are depicted in red. Color gradient and three-dimensional cube colors are the same as in Figure 3.
Figure 7
Figure 7
Visualization of (A) corticopontine/corticospinal pathways, (B) superior cerebellar peduncle pathways, (C) middle cerebellar peduncle pathways, and (D) medial lemniscus pathways inferred from the three acquisition resolution datasets and registered to the 0.333 mm data. Color gradient represents the amount of spatial overlap between the pathways inferred in from the three acquisition resolutions: yellow colored voxels are common to all three acquisition resolutions, red is common to any two acquisition resolution datasets, and blue is found in only a single dataset.

References

    1. Basser P. J., Jones D. K. (2002). Diffusion-tensor MRI: theory, experimental design and data analysis – a technical review. NMR Biomed. 15, 456–46710.1002/nbm.783 - DOI - PubMed
    1. Basser P. J., Mattiello J., Lebihan D. (1994). MR diffusion tensor spectroscopy and imaging. Biophys. J. 66, 259–26710.1016/S0006-3495(94)80775-1 - DOI - PMC - PubMed
    1. Basser P. J., Pajevic S., Pierpaoli C., Duda J., Aldroubi A. (2000). In vivo fiber tractography using DT-MRI data. Magn. Reson. Med. 44, 625–63210.1002/1522-2594(200010)44:4<625::AID-MRM17>3.0.CO;2-O - DOI - PubMed
    1. Bastin M. E., Armitage P. A., Marshall I. (1998). A theoretical study of the effect of experimental noise on the measurement of anisotropy in diffusion imaging. Magn. Reson. Imaging 16, 773–78510.1016/S0730-725X(98)00098-8 - DOI - PubMed
    1. Batchelor P. G., Atkinson D., Hill D. L. G., Calamante F., Connelly A. (2003). Anisotropic noise propagation in diffusion tensor MRI sampling schemes. Magn. Reson. Med. 49, 1143–115110.1002/mrm.10491 - DOI - PubMed

LinkOut - more resources