. 2013 Dec;25(12):2383-90.
doi: 10.1016/j.cellsig.2013.07.019. Epub 2013 Jul 27.

Release of targeted p53 from the mitochondrion as an early signal during mitochondrial dysfunction

Affiliations

Release of targeted p53 from the mitochondrion as an early signal during mitochondrial dysfunction

M L Green et al. Cell Signal. 2013 Dec.

Abstract

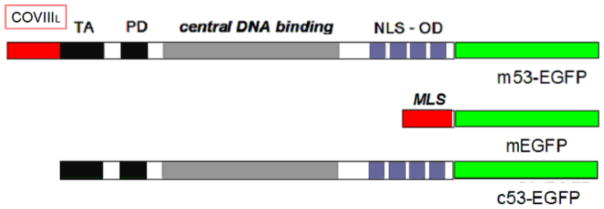
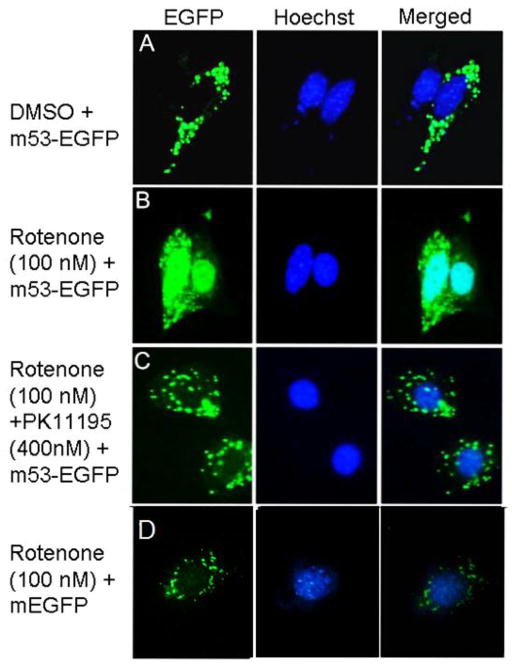
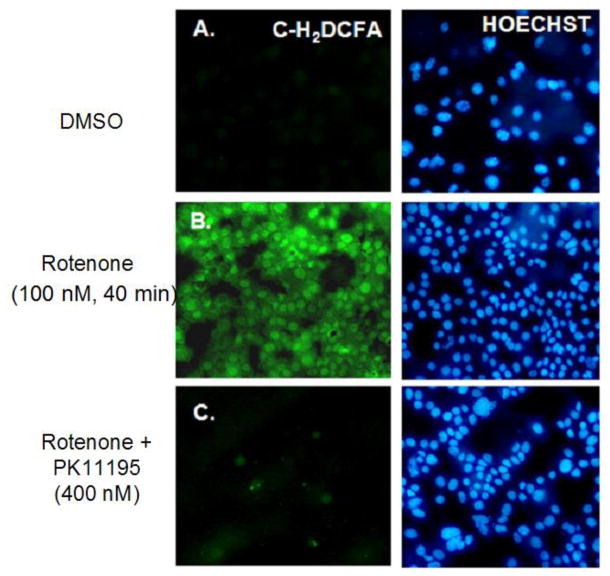
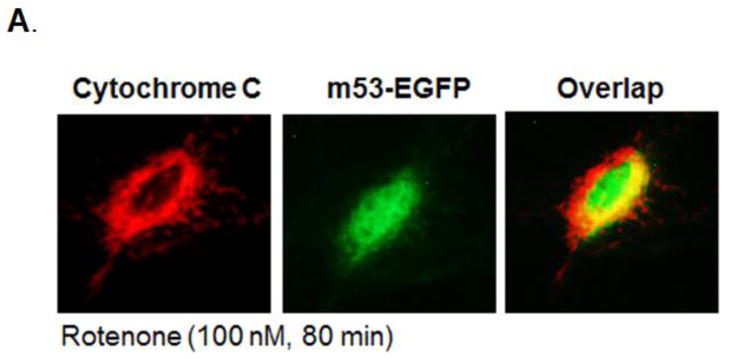
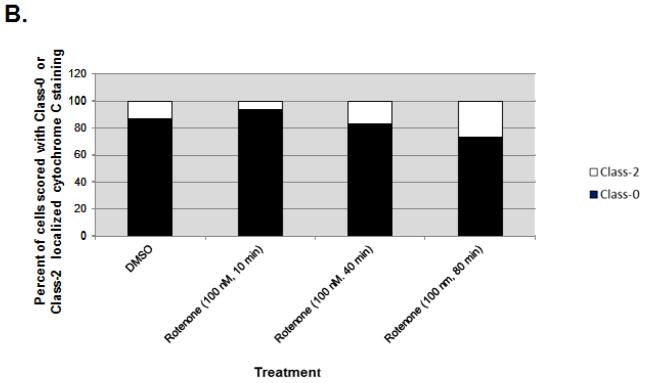
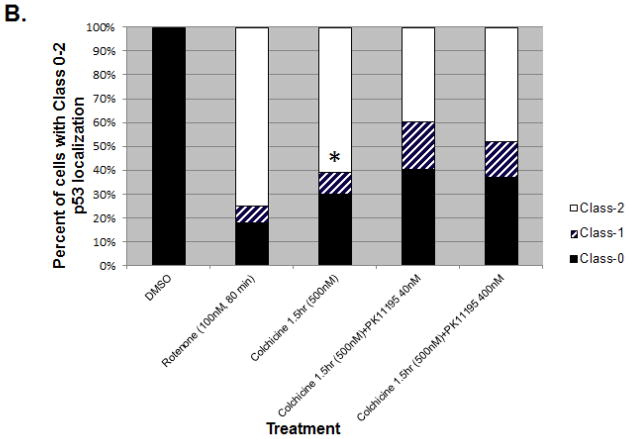
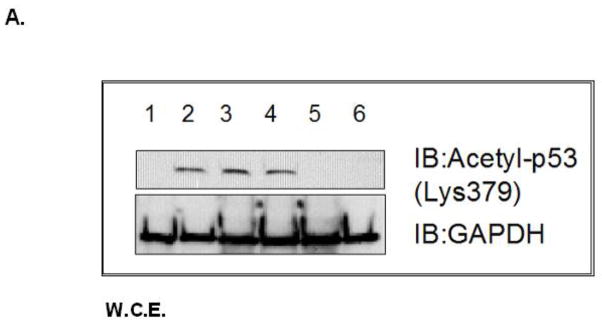
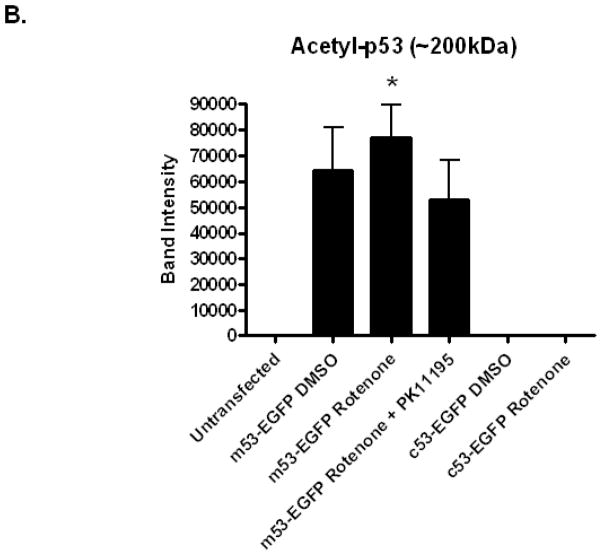
Increased accumulation of p53 tumor suppressor protein is an early response to low-level stressors. To investigate the fate of mitochondrial-sequestered p53, mouse embryonic fibroblast cells (MEFs) on a p53-deficient genetic background were transfected with p53-EGFP fusion protein led by a sense (m53-EGFP) or antisense (c53-EGFP) mitochondrial import signal. Rotenone exposure (100nM, 1h) triggered the translocation of m53-EGFP from the mitochondrion to the nucleus, thus shifting the transfected cells from a mitochondrial p53 to a nuclear p53 state. Antibodies for p53 serine phosphorylation or lysine acetylation indicated a different post-translational status of recombinant p53 in the nucleus and mitochondrion, respectively. These data suggest that cycling of p53 through the mitochondria may establish a direct pathway for p53 signaling from the mitochondria to the nucleus during mitochondrial dysfunction. PK11195, a pharmacological ligand of mitochondrial TSPO (formerly known as the peripheral-type benzodiazepine receptor), partially suppressed the release of mitochondria-sequestered p53. These findings support the notion that p53 function mediates a direct signaling pathway from the mitochondria to nucleus during mitochondrial dysfunction.

Keywords: Embryo; Mitochondria; PK11195; Rotenone; TspO; p53.


Conflict of interest statement

Conflict of interest statement: None declared.

Figures

Fig. 1
Fig. 1. Schematic representation of p53 and deduced proteins
The p53 protein contains an N-terminal transactivation domain (TA), and proline-rich domain(PD) (black), a sequence–specific DNA binding domain (gray) and a C-terminal tetramerization domain (blue) containing a nuclear localization sequence (NLS) with or without an EGFP tag (green). Vectors target the nucleus (c53-EGFP) or mitochondria which contain the cytochrome c oxidase subunit 8 (CoxVIII) mitochondrial localization (MLS) in red (mEGFP and m53-EGFP).
Fig. 2
Fig. 2. Recombinant p53 translocates from the mitochondria to nucleus upon rotenone treatment of MEF cells
Panel A: Mitochondria-targeted p53-EGFP remains localized to mitochondria in sham treated cultures. Panel B: Rotenone exposure (100 nM, 80 min) in p53 null MEF cell cultures induces p53 translocation from the mitochondria to the nucleus as shown with overlapping Hoechst stain. Panel C: Co-treatment of rotenone (100 nM, 80 min) and PK11195 (peripheral benzodiazepine receptor ligand) largely-prevents p53 nuclear translocation. Panel D: mEGFP transfected p53 null cells treated with rotenone. Magnification 40x.
Fig. 3
Fig. 3. Optimal time for m53-EGFP export is 80 minutes
m53-EGFP transfected p53 null MEFs were treated with either rotenone (100 nM) (blue and white solid and striped columns) or rotenone (100 nM) with PK11195 (400 nM) (black and white solid and striped columns). Cells were scored as class-0 (mitochondrial p53), class-1 (mitochondrial and nuclear p53) or class-3 (nuclear p53). At 0 minutes, cells were scored as class-0 only, whereas; rotenone treatment was scored as class 0–2 at varying levels. PK11195 decreased the amount of m53-EGFP released at the optimal time point (80 min) by 50%. There was a significant difference in mitochondrial localization as assessed by a two-tailed T test (*p<0.01 at 0 min vs. 80 min rotenone exposure and *p<0.05 for 80 min rotenone exposure vs 80 min rotenone + PK11195 exposure).
Fig. 4
Fig. 4. Nanomolar concentrations of rotenone induce ROS accumulation
A: p53 null MEF cells were either DMSO vehicle or B: Rotenone (100 nM, 40 min) treated and exposed to C-H2DCFA dye to detect total cellular ROS. C: Rotenone and PK11195 (400 nM) co-treatment. Results show positive accumulation of ROS in cells treated with rotenone observed by green fluorescence in panel B.
Fig. 5
Fig. 5. Mitochondria to nuclear p53 translocation precedes cytochrome c release
A: Cytochrome c: Immunofluorescent staining of mitochondrial localized cytochrome c (red) in rotenone exposed (100 nM, 80 min) p53 null MEFs. m53-EGFP: Mitochondria-targeted p53-EGFP (green) translocates to nucleus upon rotenone exposure in p53 null transfected cells. Overlap: Overlap of cytochrome c and p53-EGFP suggests p53 nuclear translocation occurs before cytochrome c release, an indicator of apoptosis. Magnification 40x. B: Bar graph shows the number of cells (100 m53-EGFP transfected cells scored per treatment) with cytochrome c localized to mitochondria (black columns). Results show that upon rotenone treatment, cytochrome c remains in mitochondria while m53-EGFP translocates from mitochondria to nucleus.
Fig. 6
Fig. 6. Colchicine treatment induces m53-EGFP translocation from mitochondria to nucleus
A: Colchicine does not induce ROS, suggesting that ROS accumulation is independent of m53-EGFP translocation. B: Bar graph shows ratio of m53-EGFP localization to either mitochondria, Class-0 (black); nucleus, Class-2 (white) or both, Class-1 (striped) compartments. Co-treatment of colchicine + PK11195 does not completely inhibit nuclear translocation. *p<0.05 colchicine vs. colchicine w/ PK11195
Fig. 7
Fig. 7. Phosphorylation at serine 15 of p53 occurs once m53-EGFP is released from the mitochondria to nucleus
A: m53-EGFP (green) transfected p53 null cells were either treated with DMSO vehicle control or rotenone (100 nM, 80 min). Phosphorylated p53 (red) did not occur in the mitochondria in any of the controls. Rotenone treatment induced release of mitochondrial p53 to nucleus (blue). Only phosphorylation at serine 15 occurred when p53 translocated to the nucleus. NOTE: mEGFP is retained upon rotenone treatment (data not shown). Magnification 20x. B: Bar graph shows ratio of 100 m53-EGFP transfected cells scored for each group with m53-EGFP localization to either mitochondria, Class-0 (black); nucleus, Class-2 (white) or both, Class-1 (striped) compartments. Treatment with DMSO were Class-0 only whereas, Class-2 cells in the rotenone (100 nM, 80 min) treated group all stained positive for Ser-15.
Fig. 8
Fig. 8. Acetylation at Lys 379 of p53 occurs in m53-EGFP stable transfected cell lysates
Whole cell lysates from A: Lane 1: p53 null MEF, Lane 2–4: m53-EGFP transfected p53 null MEF (1) untreated (2) rotenone (100 nM, 80 min), (3) PK11195 (4 nM) co-treat, Lane 5–6: c53-EGFP transfected p53 null MEF, (5) untreated, (6) rotenone treated. GAPDH loading control for total cell lysates. B: Quantitation of band intensity for acetyl-p53 (200 kDa band) using p53:GAPDH ratio. *P<0.05 Two-tailed t-test (rotenone vs rotenone w/PK11195 m53-EGFP transfected cells).

Similar articles

Cited by

References

    1. Gasparre G, Kurelac I, Capristo M, Iommarini L, Ghelli A, Ceccarelli C, Nicoletti G, Nanni P, De Giovanni C, Scotlandi K, Betts C, Carelli V, Lollini P, Romeo G, Rugolo M, Porcelli A. Cancer Res. 2011 Oct 1;71(19):6220–6229. - PubMed
    1. Modica-Napolitano J, Kulawiec M, Singh K. Curr Mol Med. 2007 Feb;(1):121–31. Review. - PubMed
    1. Larosche I, Lettéron P, Fromenty B, Vadrot N, Abbey-Toby A, Feldmann G, Pessavre D, Mansouri A. J Pharm and Exp Thera. 2007;321(2):526–535. - PubMed
    1. Desouki M, Kulawiec M, Bansal S, Das G, Singh K. Cancer Biol Ther. 2005 Dec;4(12):1367–73. - PubMed
    1. Zhou S, Kachhap S, Singh K. Mutagenesis. 2003;18:287–292. - PubMed

Publication types

MeSH terms