Review
. 2013:119:155-90.
doi: 10.1016/B978-0-12-396971-2.00007-5.

Circadian rhythms, sleep deprivation, and human performance

Affiliations
Review

Circadian rhythms, sleep deprivation, and human performance

Namni Goel et al. Prog Mol Biol Transl Sci. 2013.

Abstract

Much of the current science on, and mathematical modeling of, dynamic changes in human performance within and between days is dominated by the two-process model of sleep-wake regulation, which posits a neurobiological drive for sleep that varies homeostatically (increasing as a saturating exponential during wakefulness and decreasing in a like manner during sleep), and a circadian process that neurobiologically modulates both the homeostatic drive for sleep and waking alertness and performance. Endogenous circadian rhythms in neurobehavioral functions, including physiological alertness and cognitive performance, have been demonstrated using special laboratory protocols that reveal the interaction of the biological clock with the sleep homeostatic drive. Individual differences in circadian rhythms and genetic and other components underlying such differences also influence waking neurobehavioral functions. Both acute total sleep deprivation and chronic sleep restriction increase homeostatic sleep drive and degrade waking neurobehavioral functions as reflected in sleepiness, attention, cognitive speed, and memory. Recent evidence indicating a high degree of stability in neurobehavioral responses to sleep loss suggests that these trait-like individual differences are phenotypic and likely involve genetic components, including circadian genes. Recent experiments have revealed both sleep homeostatic and circadian effects on brain metabolism and neural activation. Investigation of the neural and genetic mechanisms underlying the dynamically complex interaction between sleep homeostasis and circadian systems is beginning. A key goal of this work is to identify biomarkers that accurately predict human performance in situations in which the circadian and sleep homeostatic systems are perturbed.

Keywords: Chronotype; Circadian rhythms; Genetics; Individual differences; Neuroimaging; Performance; Phenotype; Sleep deprivation; Sleep homeostasis; Two-process model.


Figures

Figure 7.1
Figure 7.1
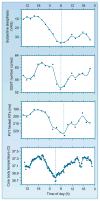
Circadian variation across a 40-h period of wakefulness in measures of subjective sleepiness as assessed by visual analogue scale (VAS, note reversed scale direction); in cognitive performance speed as assessed by the digit symbol substitution task (DSST); in psychomotor speed as reflected in the 10% fastest reaction times (RT) assessed by the Psychomotor Vigilance Test (PVT); and in core body temperature (CBT) as assessed by a rectal thermistor. Data shown are the mean values from five subjects who remained awake in dim light, in bed, in a constant routine protocol, for 36 h consecutively (a distance-weighted least-squares function was fitted to each variable). The circadian trough is evident in each variable (marked by vertical broken lines). A phase difference is also apparent such that all three neurobehavioral variables had their average minimum between 3.0 and 4.5 h after the time of the body temperature minimum. This phase delay in neurobehavioral functions relative to CBT has been consistently observed. Although body temperature reflects predominantly the endogenous circadian clock, neurobehavioral functions are also affected by the homeostatic pressure for sleep, which escalates with time awake and which may contribute to the phase delay through interaction with the circadian clock. Neurobehavioral functions usually show a circadian decline at night as is observed in CBT, but they continue their decline after CBT begins to rise, making the subsequent 2–6 h period (clock time approximately 0600–1000 h) a zone of maximum vulnerability to loss of alertness and to performance failure. Reprinted with permission from Ref. .
Figure 7.2
Figure 7.2
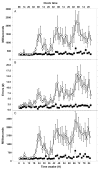
Psychomotor Vigilance Test (PVT) performance parameters of healthy adults during an 88 h period of limited to no sleep in the laboratory. The open circles represent 13 subjects undergoing 88 h of total sleep deprivation, and the filled squares represent 15 control subjects given a 2-h time in bed nap opportunity once every 12 h (0245–0445 h and 1445–1645 h) throughout the 88 h period (nap times are not shown in the figure). Graph A: mean (SEM) PVT reaction times (RT), which as RTs >500 ms are frank errors of omission and referred to as lapses of attention (i.e., responding too slowly). Graph B: mean (SEM) PVT errors of commission, which result from premature responses and reflect impulsiveness (i.e., responding too fast). Graph C: mean (SEM) of PVT RT standard deviations for each test bout, reflecting the magnitude of interindividual differences in performance. The subjects who underwent 88 h without sleep showed clear circadian variation in both lapses of attention (A) and premature responses (B), as well as interindividual differences in these effects (C). Figure adapted and modified with permission from Ref. .
Figure 7.3
Figure 7.3
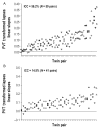
The individual linear slopes of the change in Psychomotor Vigilance Task (PVT) transformed lapses during 38 h of total sleep deprivation in monozygotic (MZ; A) and dizygotic (DZ; B) twin pairs. Data for each MZ and DZ twin pair are plotted together on the abscissa. In each panel, the pairs are ordered by the magnitude of their impairment (averaged over each pair), with the most resistant twin pair on the left and the most vulnerable twin pair on the right. The panels reveal substantial differences in individual responses to sleep deprivation. The intraclass correlation (ICC) revealed greater similarity within MZ twin pairs than within DZ twin pairs. There was 56.2% of the total variance in the MZ twins due to variance between pairs whereas only 14.5% of the total variance in DZ twins was due to variance between pairs. Reprinted with permission from Ref. .
Figure 7.4
Figure 7.4
Time-of-day effects on absolute cerebral blood flow (CBF) activation during the Psychomotor Vigilance Test (PVT). Twenty healthy adults performed the PVT in the morning (between 0700– and 0900 h) and a separate group of 15 healthy adults performed the PVT in the afternoon (between 1400– and 1700 h)—both groups did so during ASL perfusion f MRI scanning. Brain scans at both times of day showed significant activation in the sensorimotor, cingulate, and frontoparietal regions. However, thalamic activation (indicated by the arrows in A) was only observed in the morning scan while increased activation in the right frontal eye field (indicated by the arrow in B) was observed in the afternoon scan (Hengyi Rao, unpublished data).

References

    1. Siegel JM. Sleep viewed as a state of adaptive inactivity. Nat Rev Neurosci. 2009;10:747–753. - PMC - PubMed
    1. Buxton OM, Cain SW, O’Connor SP, et al. Adverse metabolic consequences in humans of prolonged sleep restriction combined with circadian disruption. Sci Transl Med. 2012;4:129ra143. - PMC - PubMed
    1. Arble DM, Bass J, Laposky AD, Vitaterna MH, Turek FW. Circadian timing of food intake contributes to weight gain. Obesity. 2009;17:2100–2102. - PMC - PubMed
    1. Goel N, Stunkard AJ, Rogers NL, et al. Circadian rhythm profiles in women with night eating syndrome. J Biol Rhythms. 2009;24:85–94. - PMC - PubMed
    1. Kobayashi D, Takahashi O, Deshpande GA, Shimbo T, Fukui T. Association between weight gain, obesity, and sleep duration: a large-scale 3-year cohort study. Sleep Breath. 2012;16:829–833. - PubMed

Publication types

LinkOut - more resources