. 2013 Sep 11;32(18):2439-53.
doi: 10.1038/emboj.2013.170. Epub 2013 Jul 30.

An ER-peroxisome tether exerts peroxisome population control in yeast

Affiliations

An ER-peroxisome tether exerts peroxisome population control in yeast

Barbara Knoblach et al. EMBO J. .

Abstract

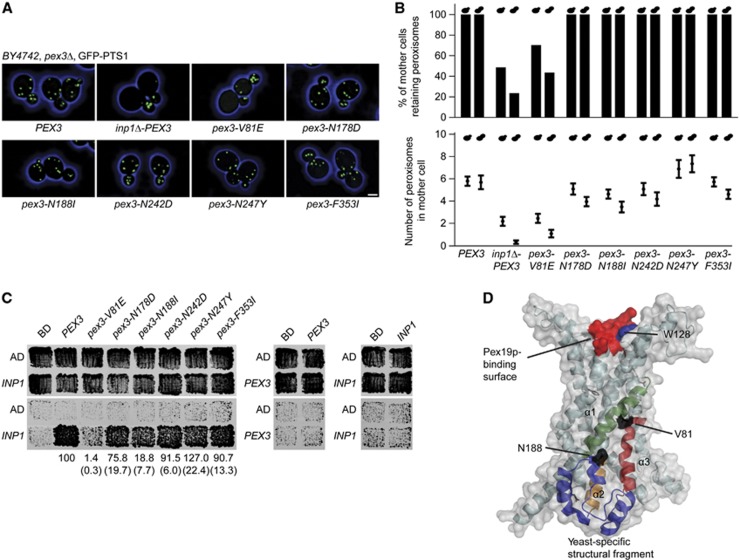
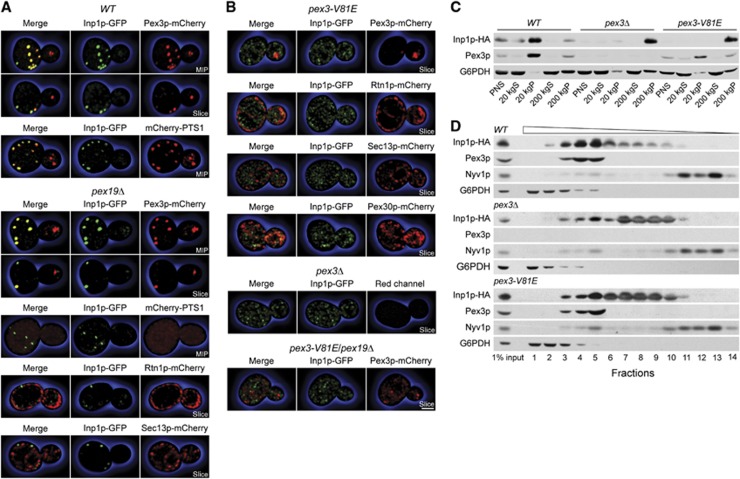
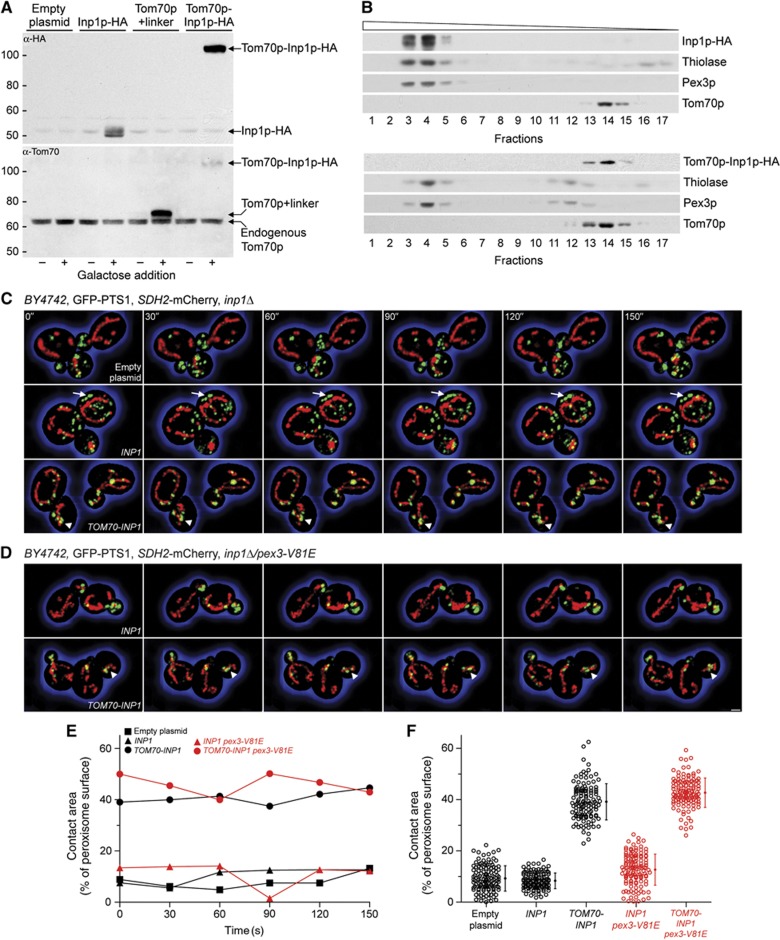
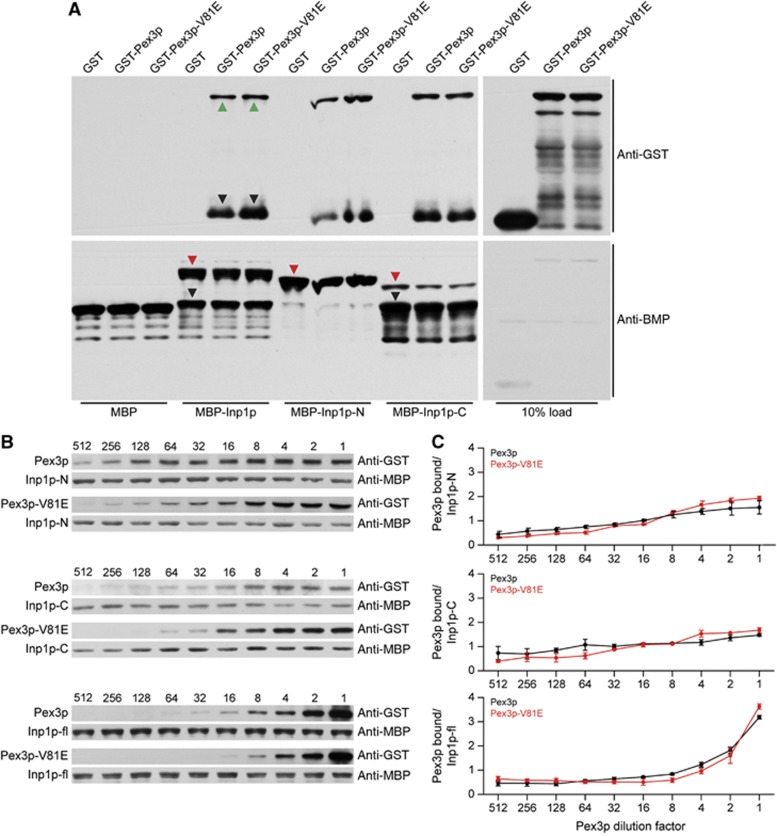
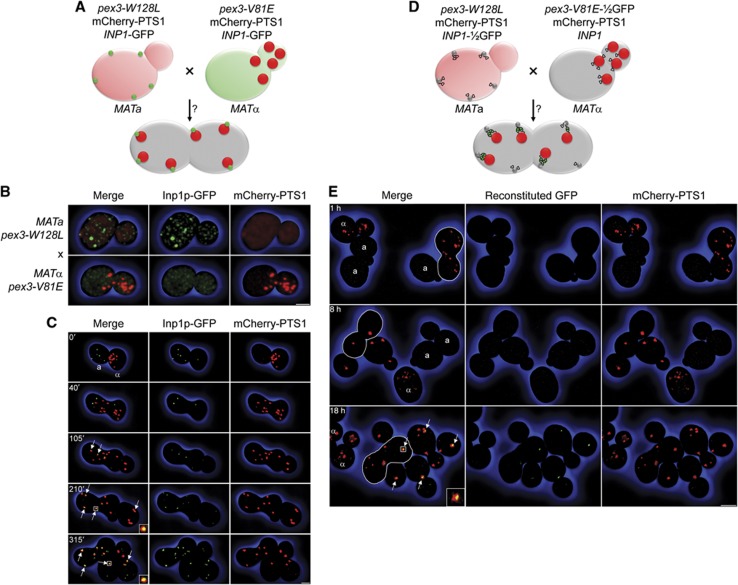
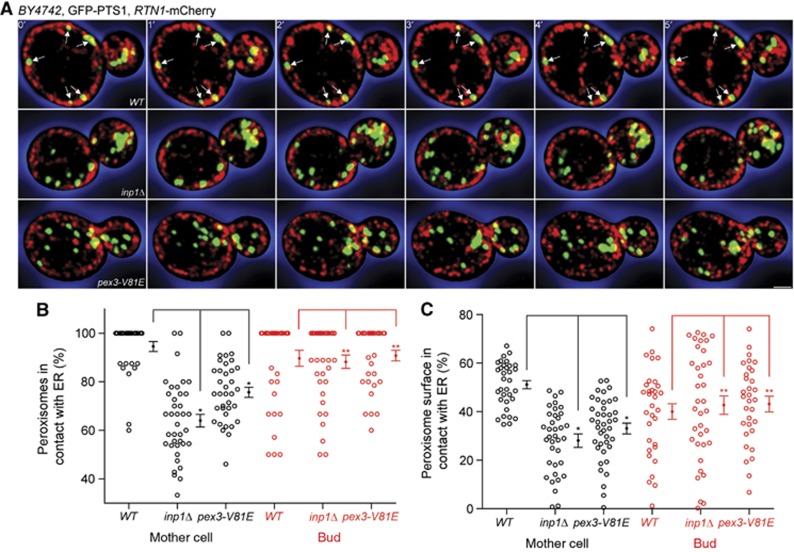
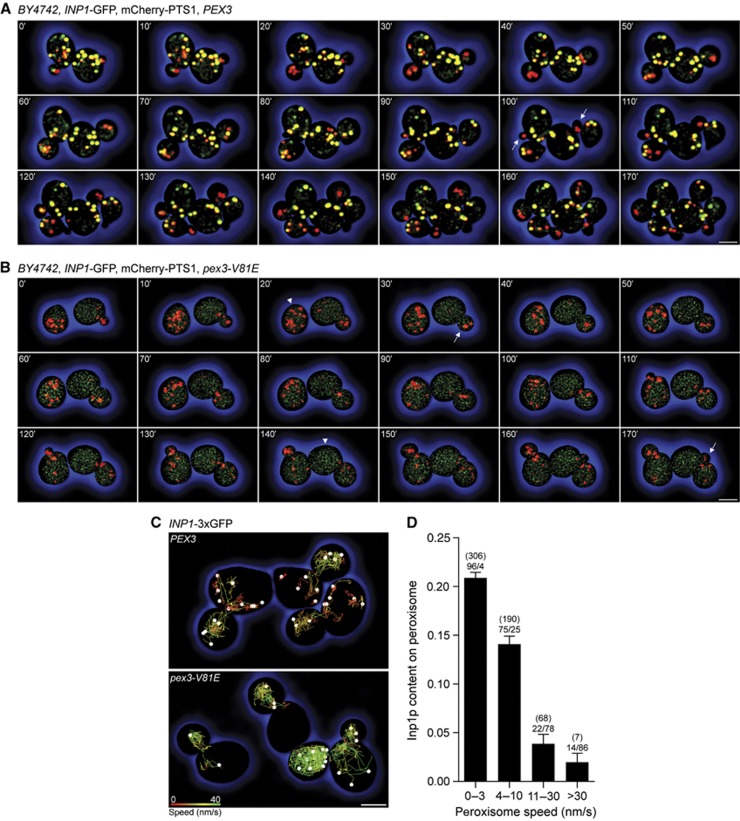
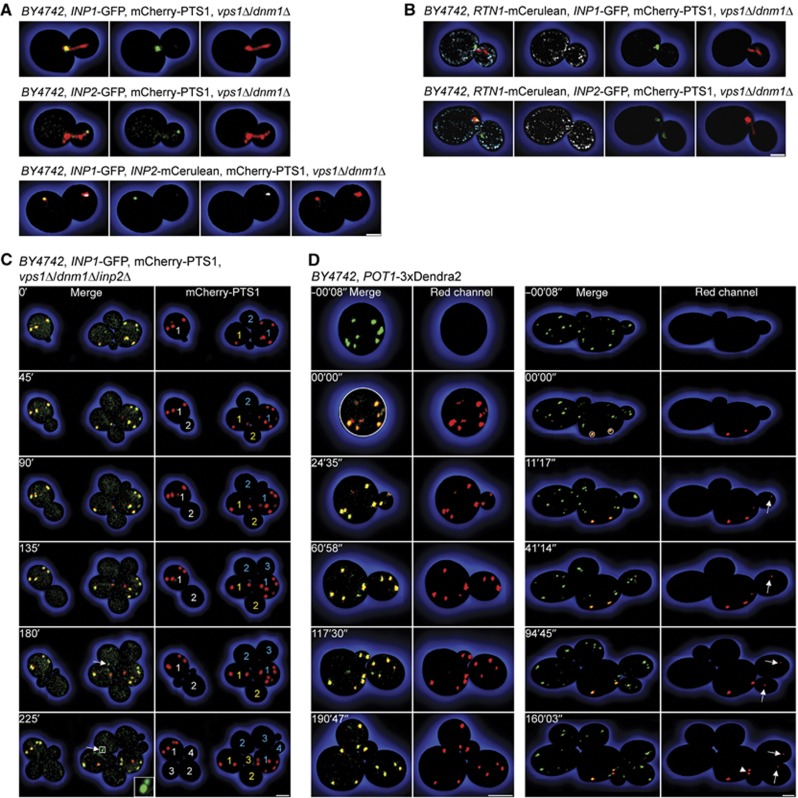
Eukaryotic cells compartmentalize biochemical reactions into membrane-enclosed organelles that must be faithfully propagated from one cell generation to the next. Transport and retention processes balance the partitioning of organelles between mother and daughter cells. Here we report the identification of an ER-peroxisome tether that links peroxisomes to the ER and ensures peroxisome population control in the yeast Saccharomyces cerevisiae. The tether consists of the peroxisome biogenic protein, Pex3p, and the peroxisome inheritance factor, Inp1p. Inp1p bridges the two compartments by acting as a molecular hinge between ER-bound Pex3p and peroxisomal Pex3p. Asymmetric peroxisome division leads to the formation of Inp1p-containing anchored peroxisomes and Inp1p-deficient mobile peroxisomes that segregate to the bud. While peroxisomes in mother cells are not released from tethering, de novo formation of tethers in the bud assists in the directionality of peroxisome transfer. Peroxisomes are thus stably maintained over generations of cells through their continued interaction with tethers.


Conflict of interest statement

The authors declare that they have no conflict of interest.

Figures

Figure 1
Figure 1
Cells expressing pex3-V81E have a defect in peroxisome retention. (A) Strain BY4742 lacking the PEX3 gene and expressing the peroxisomal reporter GFP-PTS1 was transformed with plasmids encoding either wild-type PEX3 or mutant pex3 sequences. The strain inp1Δ-PEX3 also carried a deletion of the INP1 gene. Images were acquired by confocal fluorescence microscopy and flattened into maximum intensity projections. Bar, 1 μm. (B) Mother cells were scored for the presence or absence of peroxisomes (upper panel) or total peroxisome numbers (mean±s.e.m., lower panel). Small and large bud size categories are presented in the left and right bars. Quantification was done on at least 100 budded cells of each strain. (C) Yeast two-hybrid analysis to score for interaction between Inp1p and Pex3p. Upper panels show total growth of strains, while bottom panels show growth arising from protein interaction. Strength of interaction between mutant Pex3 proteins and Inp1p in β-galactosidase assays is presented as mean±s.e.m. (brackets) of three independent experiments. (D) Model of Pex3p. Secondary elements likely involved in interacting with Inp1p are highlighted (helices α1, green; α2, orange; and α3, red; yeast-specific structure, blue). The surface of the model is displayed in grey, while the mutated residues V81 and N188 are in black. The approximate binding site for Pex19p is shown in red. Mutagenesis of W128 is described below (Figure 5). See Supplementary Movie 1.
Figure 2
Figure 2
Pex3p and Inp1p segregate to distinct membranous compartments. (A, B) Wild-type BY4742 cells (WT), as well as pex19Δ, pex3-V81E, pex3Δ, and pex19Δ/pex3-V81E mutant cells, were imaged by confocal fluorescence microscopy. Cells expressed Inp1p-GFP and one of Pex3p-mCherry, mCherry-PTS1, Sec13p-mCherry, Pex30p-mCherry, and Rtn1p-mCherry. Maximum intensity projections (MIP) and optical sections (slice) are shown. Bar, 1 μm. (C) PNS from WT, pex3Δ, and pex3-V81E cells was separated by differential centrifugation into 20 and 200 kg supernatant and pellet fractions. Equal amounts of protein were resolved by SDS–PAGE, and immunoblots were probed with antibodies against HA, Pex3p, and G6PDH. (D) Vesicles in PNS prepared from the same strains as in (C) were floated in a step gradient of sucrose solutions of decreasing density. Equal portions of fractions were analysed by immunoblotting for the indicated proteins. Wedge depicts fraction density. Source data for this figure is available on the online supplementary information page.
Figure 3
Figure 3
Ectopic expression of Inp1p on the surface of the mitochondria tethers peroxisomes to mitochondria. (A) Production of Inp1p-HA, Tom70p+linker, and Tom70p-Inp1p-HA from the GAL1 promoter. Samples were collected before and 2 h after galactose addition. Immunoblots of whole-cell lysates were probed with antibodies against HA and Tom70p. Endogenous Tom70p is an internal loading control. Numbers at left represent molecular mass markers. (B) Cells transformed with plasmids coding for Inp1p-HA (top panel) or Tom70p-Inp1p-HA (bottom panel) were grown for 15 h in oleate-containing medium. Recombinant proteins were induced for 90 min prior to fractionation. The peroxisomal and mitochondrial fractions were identified by immunodetection of thiolase, Pex3p, and Tom70p, respectively. Wedge depicts fraction density. (C, D) inp1Δ (C) and inp1Δ/pex3-V81E (D) cells expressing GFP-PTS1 and Sdh2p-mCherry were transformed with empty plasmid or plasmid expressing INP1 or TOM70-INP1 (inserts), and transgenes were induced for 30 min. Six consecutive frames from a time-lapse series are shown. Arrows depict static peroxisomes. Arrowheads show clumped peroxisomes and mitochondria. Bar, 1 μm. (E) The peroxisomal and mitochondrial surfaces were computed using Imaris software. Contact area is expressed as a percentage of the total peroxisome surface. Quantification was done on the images presented in (C) and (D). (F) Association of peroxisomes with the mitochondria. Recordings of all individual time points and their means±s.e.m. are presented. See Supplementary Movies 2–4. Source data for this figure is available on the online supplementary information page.
Figure 4
Figure 4
The V81 residue of Pex3p is not required for direct binding of Inp1p. (A) MBP alone or MBP–Inp1p fusions immobilized to amylose beads were incubated with extracts of E. coli synthesizing GST, GST-Pex3p, or GST-Pex3p-V81E. Bound proteins were detected by immunoblotting with anti-GST antibody (upper panel). Total MBP fusion proteins were visualized by immunoblotting with anti-MBP antibody (lower panel). Inp1p-N and Inp1p-C are N-terminal (a.a. 1–280) and C-terminal (a.a. 281–420) fragments of Inp1p. Red triangles indicate full-length MBP fusions, green triangles indicate full-length GST fusions, and black triangles indicate degradation products. (B) Equimolar amounts of purified recombinant MBP–Inp1p, MBP–Inp1p-N, and MBP–Inp1p-C were coupled individually to amylose beads and incubated with serial dilutions of E. coli lysates containing GST-Pex3p or GST-Pex3p-V81E. Dilution factors are denoted above immunoblots. GST- and MBP-fusion proteins were detected as in (A). (C) The ratio of bound Pex3p or bound Pex3p-V81E to Inp1p obtained by densitometric analysis of the bands in (B) was plotted against the Pex3p-dilution factor. The means±s.e.m. of three independent experiments are presented. Source data for this figure is available on the online supplementary information page.
Figure 5
Figure 5
Inp1p acts as a molecular hinge between ER and peroxisomes. (A) Mating assay. Cells expressing mCherry-PTS1 and Inp1p-GFP and either Pex3p-W128L (MATa) or Pex3p-V81E (MATα) were mated to evaluate reconstitution of peroxisome tethering in the diploid cell. (B) Haploid cells used for mating in (A). Bar, 1 μm. (C) Time-lapse series of images of cells mated as depicted in (A). Time 0′ denotes cell fusion. MATa and MATα cells are labelled. Arrows highlight tethered peroxisomes in the zygote (105′) and its progeny (210′, 315′). Inserts show tethering complexes at high magnification. Bar, 3 μm. (D) Combined mating and split-GFP assay. Cells expressing mCherry-PTS1 and either Pex3p-W128L and Inp1p-½GFP (MATa) or Pex3p-V81E-½GFP and Inp1p (MATα) were mated to evaluate reconstitution of GFP fluorescence via interaction between Inp1p-½GFP in foci and Pex3p-V81E-½GFP on the surface of peroxisomes. (E) Images of cells at different times following the mating depicted in (D). Haploid cells are designated a and α. Zygotes are outlined. Diploid cells are unlabelled. Arrows highlight reconstitution of GFP fluorescence in tethering complexes. The insert shows a tethering complex at high magnification. Bar, 3 μm. See Supplementary Movie 5.
Figure 6
Figure 6
Peroxisomes interact transiently with the ER in inp1Δ and pex3-V81E cells. (A) Wild-type, inp1Δ, and pex3-V81E cells expressing GFP-PTS1 and Rtn1p-mCherry were visualized by 3-D confocal video microscopy. 1 μm optical midsections of six consecutive frames of a time-lapse series are presented. Arrows show static peroxisomes. Bar, 1 μm. (B) The percentage of all peroxisomes in contact with the ER is shown for every time point (dot) of six independent recordings, of which one is depicted in (A). Bars represent means±s.e.m. Quantifications were done independently for mother cell and bud. (C) Peroxisomal and ER surfaces were computed using Imaris software. Peroxisome surface in contact with the ER is expressed as a percentage of total peroxisome surface. Quantification of six independent recordings, of which one is shown in (A), was done separately for mother cell and bud. Significant (*)/not significant (**) difference at the 99% confidence interval using a pairwise t-test. See Supplementary Movie 6.
Figure 7
Figure 7
Inp1p exhibits a polarized distribution along the cell division axis. (A, B) Peroxisome inheritance observed in budding cells expressing Inp1p-GFP, mCherry-PTS1, and either Pex3p (A) or Pex3p-V81E (B). Merged images of the red and green channels are shown. Bar, 3 μm. (C) Peroxisomes in cells expressing either Pex3p or Pex3p-V81E were tracked over the first 100 frames of Supplementary Movie 7. Peroxisomes are presented as white spheres and their trajectories as colour-coded lines (red to green, 0–40 nm/s). Bar, 3 μm. (D) Inp1p content and peroxisome speed were computed for each peroxisome and each time point for the top panel of Supplementary Movie 7. Peroxisomes are grouped into speed categories and plotted against their Inp1p content. Bars show mean±s.e.m. Figures in brackets denote the number of individual recordings per category, while the percentages of mother cell- to bud-localized peroxisomes are displayed below the bracketed numbers.
Figure 8
Figure 8
Peroxisome inheritance requires peroxisome division. (A) Inp1p and Inp2p were imaged in vps1Δ/dnm1Δ cells expressing mCherry-PTS1 and Inp1p-GFP (top panels), Inp2p-GFP (middle panels), or Inp1p-GFP and Inp2p-mCerulean (bottom panels). Panels at extreme left present merged images of the panels at right. Inp2p-mCerulean fluorescence is shown in white. Bar, 1 μm. (B) Rtn1p-mCerulean and mCherry-PTS1 were coexpressed with Inp1p-GFP (top panels) or Inp2p-GFP (bottom panels) in vps1Δ/dnm1Δ cells. Panels at extreme left present the merged images of the panels at right. Rtn1p-mCerulean fluorescence is shown in white. Images are 0.6 μm optical midsections. Bar, 1 μm. (C) vps1Δ/dnm1Δ/inp2Δ cells expressing Inp1p-GFP and mCherry-PTS1 were tracked over time. Left panels present merged images of the red and green channels. Arrows depict Inp1p-GFP foci. Right panels show mCherry-PTS1 fluorescence and numbered cell generations. Bar, 3 μm. (D) Peroxisome dynamics in wild-type cells analysed by photoconversion of the peroxisomal reporter Pot1p-3 × Dendra2. Select peroxisomes were photoconverted from green to red, and their movements were followed by time-lapse video microscopy. One of three (left) and ten (right) recordings is shown. Left panels present merged images of the red and green channels, whereas right panels present the red fluorescence channel only. Photoconverted peroxisomal material transferred to the bud is depicted by arrows. Arrowhead shows macroscopic peroxisome division. Bars, 3 μm. See Supplementary Movies 8–10.
Figure 9
Figure 9
A model for peroxisome population control. Multiple Inp1p molecules connect ER-bound Pex3p and peroxisomal Pex3p into an ER-peroxisome tethering complex that anchors a peroxisome to the cER of the mother cell. Recruitment of Inp1p, but not peroxisome tethering, to foci depends on the integrity of the patch containing V81 on the surface of Pex3p (A). Pulling forces exerted by Myo2p and constriction forces exerted by the peroxisome divisional machinery lead to elongation, constriction, and ultimate rupture of the peroxisome. The division process is asymmetric and may trigger the release of larger and smaller peroxisomal fragments, which contain Inp2p and are transported to the bud (B). After its release from Myo2p, the bud-localized peroxisome can attach to a tether that is newly formed by passage of Pex3p through the ER and recruitment of Inp1p by Pex3p (C).

Comment in

  • Give what you can and keep what you need!
    Girzalsky W, Erdmann R. Girzalsky W, et al. EMBO J. 2013 Sep 11;32(18):2424-6. doi: 10.1038/emboj.2013.180. Epub 2013 Aug 6. EMBO J. 2013. PMID: 23921554 Free PMC article.

References

    1. Agrawal G, Joshi S, Subramani S (2011) Cell-free sorting of peroxisomal membrane proteins from the endoplasmic reticulum. Proc Natl Acad Sci USA 108: 9113–9118 - PMC - PubMed
    1. Chang J, Mast FD, Fagarasanu A, Rachubinski DA, Eitzen GA, Dacks JB, Rachubinski RA (2009) Pex3 peroxisome biogenesis proteins function in peroxisome inheritance as class V myosin receptors. J Cell Biol 187: 233–246 - PMC - PubMed
    1. Fagarasanu A, Fagarasanu M, Eitzen GA, Aitchison JD, Rachubinski RA (2006) The peroxisomal membrane protein Inp2p of the peroxisome-specific receptor for the myosin V motor Myo2p of Saccharomyces cerevisiae. Dev Cell 10: 587–600 - PubMed
    1. Fagarasanu A, Mast FD, Knoblach B, Jin Y, Brunner MJ, Logan MR, Glover JN, Eitzen GA, Aitchison JD, Weisman LS, Rachubinski RA (2009) Myosin-driven peroxisome partitioning in S. cerevisiae. J Cell Biol 186: 541–554 - PMC - PubMed
    1. Fagarasanu A, Mast FD, Knoblach B, Rachubinski RA (2010) Molecular mechanisms of organelle inheritance: lessons from peroxisomes in yeast. Nat Rev Mol Cell Biol 11: 644–654 - PubMed

Publication types

MeSH terms