. 2013 Aug 28;32(17):2362-76.
doi: 10.1038/emboj.2013.157. Epub 2013 Jul 30.

The mitochondrial calcium uniporter is a multimer that can include a dominant-negative pore-forming subunit

Affiliations

The mitochondrial calcium uniporter is a multimer that can include a dominant-negative pore-forming subunit

Anna Raffaello et al. EMBO J. .

Abstract

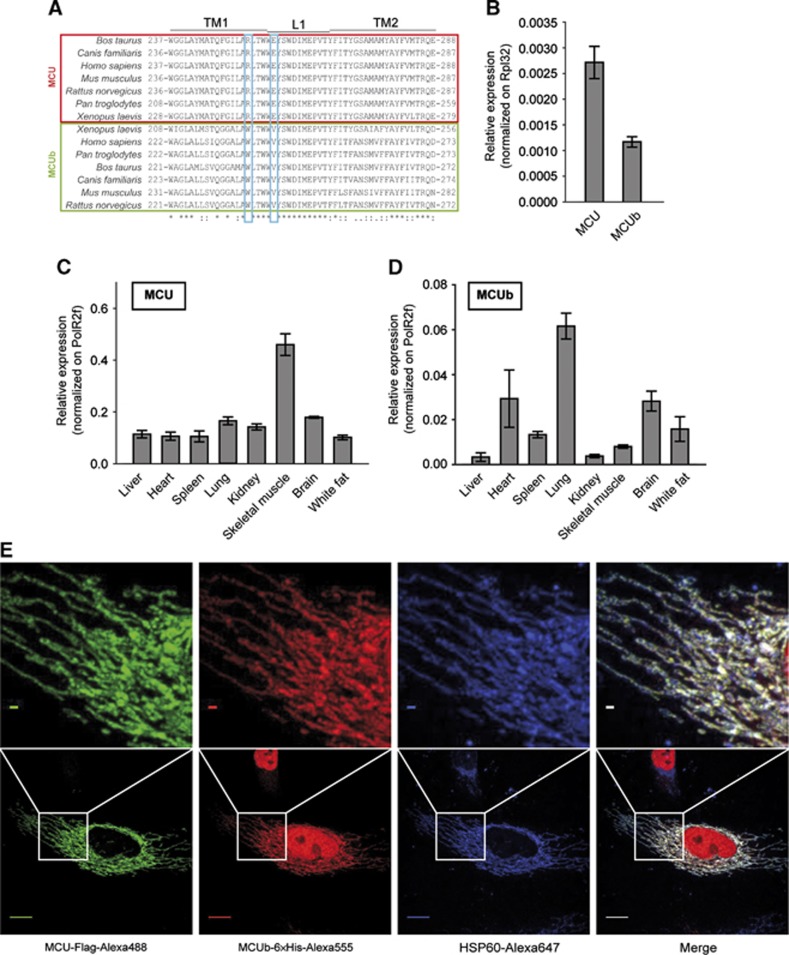
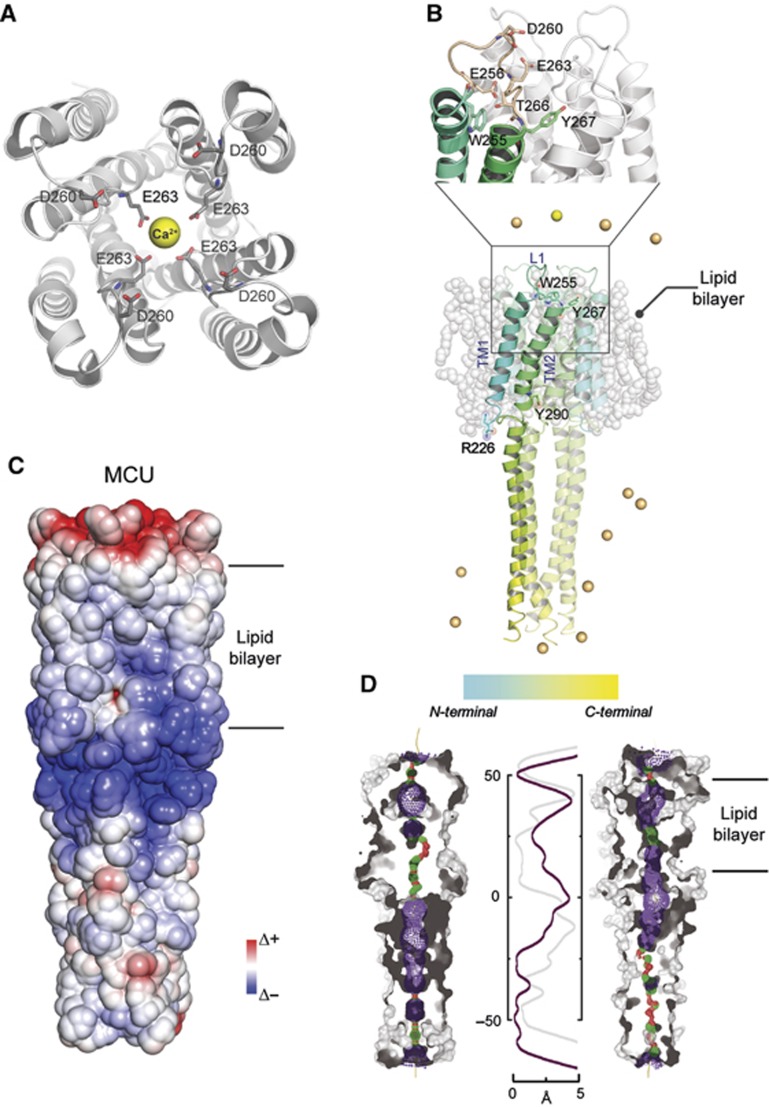
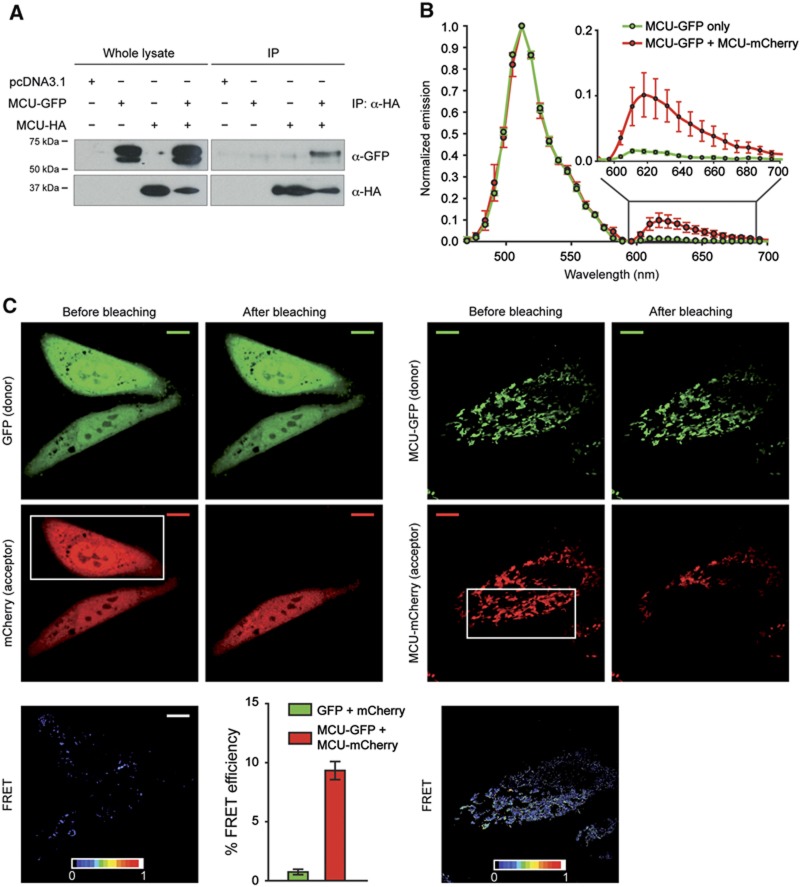
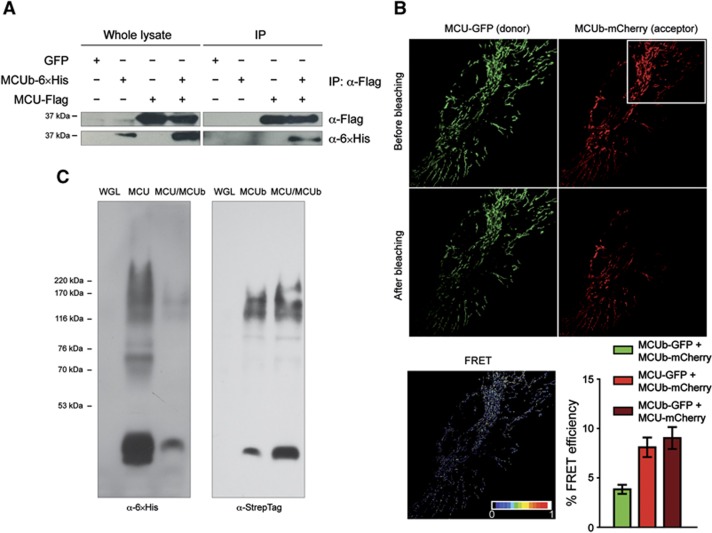
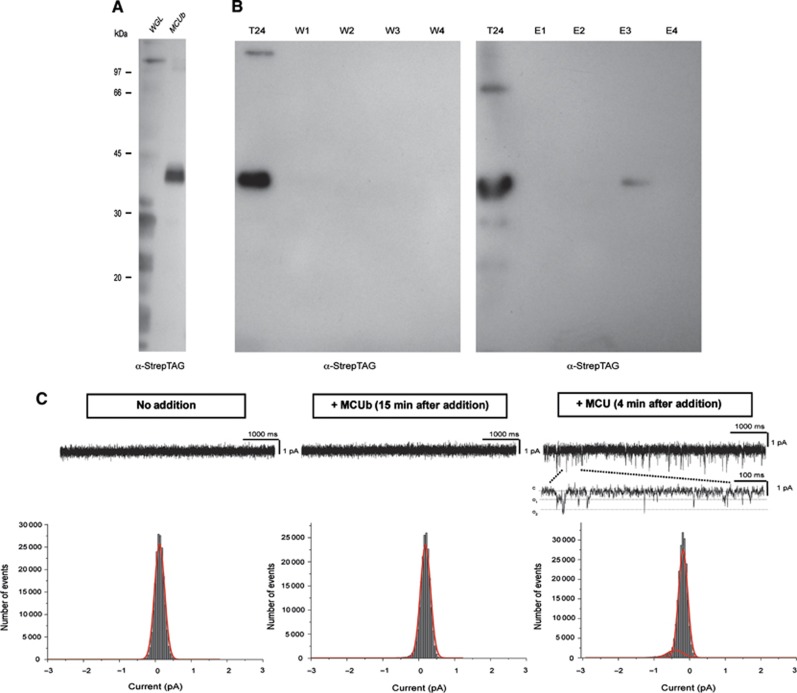
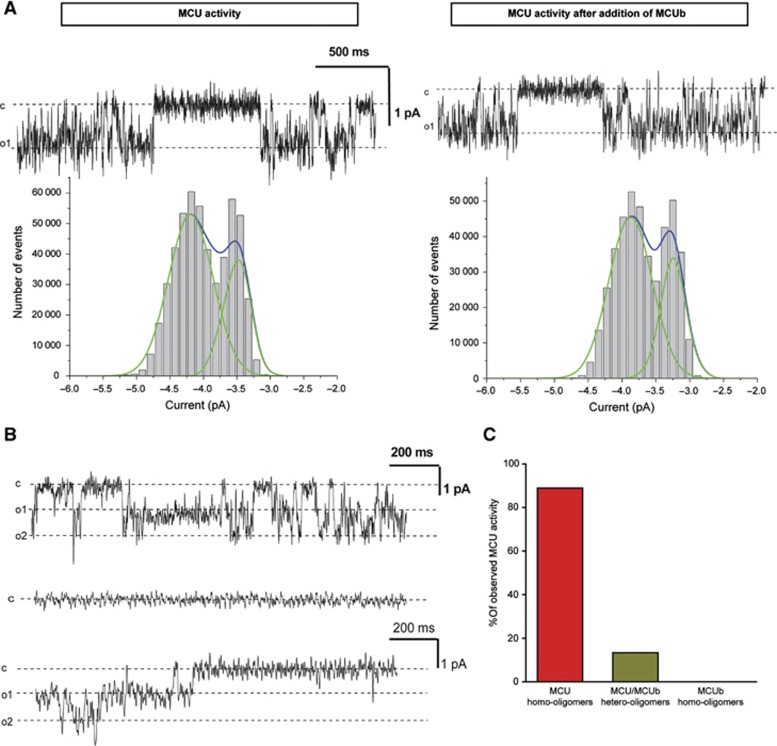
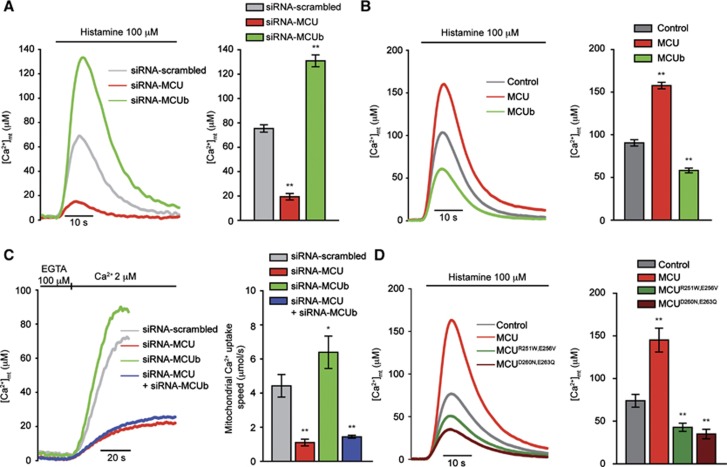
Mitochondrial calcium uniporter (MCU) channel is responsible for Ruthenium Red-sensitive mitochondrial calcium uptake. Here, we demonstrate MCU oligomerization by immunoprecipitation and Förster resonance energy transfer (FRET) and characterize a novel protein (MCUb) with two predicted transmembrane domains, 50% sequence similarity and a different expression profile from MCU. Based on computational modelling, MCUb includes critical amino-acid substitutions in the pore region and indeed MCUb does not form a calcium-permeable channel in planar lipid bilayers. In HeLa cells, MCUb is inserted into the oligomer and exerts a dominant-negative effect, reducing the [Ca(2+)]mt increases evoked by agonist stimulation. Accordingly, in vitro co-expression of MCUb with MCU drastically reduces the probability of observing channel activity in planar lipid bilayer experiments. These data unveil the structural complexity of MCU and demonstrate a novel regulatory mechanism, based on the inclusion of dominant-negative subunits in a multimeric channel, that underlies the fine control of the physiologically and pathologically relevant process of mitochondrial calcium homeostasis.


Conflict of interest statement

The authors declare that they have no conflict of interest.

Figures

Figure 1
Figure 1
The MCU isogene. (A) Multiple alignment of the TM1, L1, and TM2 regions of MCU (red) and MCUb (green) in seven different species. Blue boxes show the two critical conserved substitutions. (BD) Quantitative real-time PCR analysis of HeLa cells and mouse tissues of MCU and MCUb. (B) MCU and MCUb relative expression in HeLa cells. (C) MCU and (D) MCUb relative expression in the indicated mouse tissues as described in Materials and methods. All values are normalized to the indicated housekeeping genes. (E) Immunolocalization of MCUb. HeLa cells were transfected with MCUb-6 × His and MCU-Flag. After 24 h, the cells were fixed and immunocytochemistry was performed with α-Flag, α-6 × His, and α-HSP60 antibodies followed by incubation with Alexa488-, Alexa555-, and Alexa647-conjugated secondary antibodies as described in Materials and methods. Confocal images were taken (scale bar: 10 μm), and a region is expanded to appreciate co-localization (scale bar: 1 μm).
Figure 2
Figure 2
Predicted quaternary structure of MCU. (A) Top view of the pore region of the predicted MCU tetramer. (B) Representation of the MCU model inserted into a POPC lipid bilayer. Indicated amino acids locate the boundaries among TM1, L1, and TM2. Zoomed region: E263 and D260 side chains face the pore region of the channel. E256 and T266 interaction is critical for loop conformation and dynamics. W255 and Y267 locate the upper boundaries of TM1 and TM2, respectively. N and C-terminal portion of the MCU monomers is highlighted according to the reported colour gradient bar. Chlorine and calcium ions are depicted as green and yellow spheres, respectively. (C) Electrostatic properties surface distribution of MCU. (D) Comparison of the pore width before (left) and after (right) insertion and equilibration into a lipid bilayer. The central panel shows the calculated width along the pore (before, grey trace; after, purple trace). Predicted MCU pore surface is depicted using red, green, and violet marks. Red: pore radius (R) is below 0.6 Å, green: 0.6 Å<R<1.15 Å and blue marks place where R is above 1.15 Å.
Figure 3
Figure 3
MCU forms oligomers in vitro and in vivo. (A) Co-immunoprecipitation experiments. HeLa cells were transfected with the indicated constructs. HA-tagged MCU was immunoprecipitated from cell extracts with a specific α-HA antibody. The precipitated proteins were immunoblotted with α-HA and α-GFP antibodies. (B) Emission spectra analysis of HeLa cells transfected with MCU-GFP or MCU-GFP and MCU-mCherry and analysed after 24 h. (C) FRET analysis. HeLa cells were transfected with GFP and mCherry or MCU-GFP and MCU-mCherry and analysed after 24 h. Images of donor and acceptor were taken before and after photobleaching the indicated region (white box). FRET was calculated as detailed in Materials and methods. Histogram bar diagram shows FRET efficiency of the indicated donor and acceptor pairs. Descriptive statistics can be found in Supplementary Table S1.
Figure 4
Figure 4
MCU and MCUb form hetero-oligomers. (A) Co-immunoprecipitation experiments. HeLa cells were infected with the indicated adenoviruses. Flag-tagged MCU was immunoprecipitated from cell extracts with a specific α-Flag antibody. The co-immunoprecipitated proteins were immunoblotted with α-Flag and α-6 × His antibodies. (B) FRET analysis. HeLa cells were transfected with MCU-GFP and MCUb-mCherry and analysed after 24 h. Images of donor and acceptor were taken before and after photobleaching of the indicated region (white box). FRET was calculated as detailed in Materials and methods. Histogram bar diagram shows FRET efficiency of the indicated donor and acceptor pairs. Descriptive statistics can be found in Supplementary Table S1. (C) In vitro expression. wheat germ lysate expressing MCU-6 × His or MCUb-StrepTag alone and co-expressing MCU-6 × His/MCUb-StrepTag (2:2 ratio) was loaded on a native polyacrylamide gel without denaturing the samples. Blots were developed with anti-6 × His and anti-StrepTag antibodies.
Figure 5
Figure 5
MCUb has no channel activity in planar lipid bilayer. (A) In vitro expression of MCUb. Empty wheat germ lysate (WGL) and WGL after expression of MCUb-StrepTag were loaded on SDS–PAGE and blotted with α-StrepTag antibody. (B) Induction and purification of MCUb in E. coli. Bacteria were harvested after induction (T24) to check for the expression of the protein. Solubilized membranous fraction was passed through Strep-Tactin column; after washing (W1–W4), protein was eluted with 2.5 mM desthiobiotin (E1–E4). All samples were blotted and developed with α-StrepTag antibody. In all, 30 μl of eluted fractions/lane was loaded. (C) Electrophysiological recordings: in vitro expressed MCUb was added to the cis side (middle panel) and current was recorded for at least 10 min (n=5) without observing channel activity in 100 mM calcium-gluconate solution. Amplitude histograms, obtained from analysis of 50 s current traces recorded at −80 mV Vcis before (left panel) and 15 min after addition of MCUb (middle panel). Following addition of excess MCU (not incorporated into liposome) to the same experiment (right panel), spiky channel activity with a conductance of 7 pS has appeared (n=3). In the lower current trace, representative channel activity is shown in an extended time scale. The open probability of MCU was compatible with that previously reported for the channel recorded in the same condition (De Stefani et al, 2011). Lack of channel activity for MCUb in calcium-gluconate was also observed using the protein incorporated into liposomes (n=4).
Figure 6
Figure 6
MCU activity in the presence of MCUb. (A) Addition of excess MCUb during the same experiment does not alter the electrophysiological properties of MCU activity. Current traces recorded at −100 mV before and 6 min after addition are shown. Conductance values are 6.7 and 6.4 pS, respectively. Mean open time constants (280 ms for MCU and 360 ms after addition of MCUb) were similar. Below: respective amplitude histograms are shown. The open probability was 0.498 before and 0.513 after addition of MCUb. Similar results were obtained in two other experiments. (B) Activities observed with homomeric MCU (upper trace, representative of 8 experiments) or heteromeric MCU/MCUb (representative of 13 experiments) in liposome recorded at −140 mV are shown (middle trace). Lower current trace: in 2 cases out of 15 we recorded the activity shown using the heteromer preparation (3:1 ratio), which displayed the same characteristics as homomeric MCU. (C) Histogram showing the percentage of experiments in which activity was observed with the different preparations studied under the same conditions (MCU in 8 out of 9 cases (89%); MCU/MCUb co-expressed in 2 out of 15 cases (13%); MCUb in 0 out of 4 cases (0%).
Figure 7
Figure 7
MCUb acts as a dominant negative on MCU. (A) [Ca2+]mt measurements in control, MCU- and MCUb-silenced intact HeLa cells challenged with 100 μM histamine. (B) [Ca2+]mt measurements in intact HeLa cells overexpressing MCU or MCUb. (C) [Ca2+]mt measurements in control, MCU-, MCUb- and MCU/MCUb-silenced permeabilized HeLa cells perfused with 2 μM buffered [Ca2+]. (D) [Ca2+]mt measurements in intact HeLa cells overexpressing MCU, MCUR251W,E256V, and MCUD260N,E263Q. Descriptive statistics can be found in Supplementary Table S1. *P<0.05, **P<0.001.

References

    1. Baker NA, Sept D, Joseph S, Holst MJ, McCammon JA (2001) Electrostatics of nanosystems: application to microtubules and the ribosome. Proc Natl Acad Sci USA 98: 10037–10041 - PMC - PubMed
    1. Barel O, Shalev SA, Ofir R, Cohen A, Zlotogora J, Shorer Z, Mazor G, Finer G, Khateeb S, Zilberberg N, Birk OS (2008) Maternally inherited Birk Barel mental retardation dysmorphism syndrome caused by a mutation in the genomically imprinted potassium channel KCNK9. Am J Hum Genet 83: 193–199 - PMC - PubMed
    1. Baughman JM, Perocchi F, Girgis HS, Plovanich M, Belcher-Timme CA, Sancak Y, Bao XR, Strittmatter L, Goldberger O, Bogorad RL, Koteliansky V, Mootha VK (2011) Integrative genomics identifies MCU as an essential component of the mitochondrial calcium uniporter. Nature 476: 341–345 - PMC - PubMed
    1. Berridge MJ, Bootman MD, Roderick HL (2003) Calcium signalling: dynamics, homeostasis and remodelling. Nat Rev Mol Cell Biol 4: 517–529 - PubMed
    1. Boitier E, Rea R, Duchen MR (1999) Mitochondria exert a negative feedback on the propagation of intracellular Ca2+ waves in rat cortical astrocytes. J Cell Biol 145: 795–808 - PMC - PubMed

Publication types