. 2013 Aug 28;32(17):2407-17.
doi: 10.1038/emboj.2013.169. Epub 2013 Jul 30.

Mobilization of a plant transposon by expression of the transposon-encoded anti-silencing factor

Affiliations

Mobilization of a plant transposon by expression of the transposon-encoded anti-silencing factor

Yu Fu et al. EMBO J. .

Abstract

Transposable elements (TEs) have a major impact on genome evolution, but they are potentially deleterious, and most of them are silenced by epigenetic mechanisms, such as DNA methylation. Here, we report the characterization of a TE encoding an activity to counteract epigenetic silencing by the host. In Arabidopsis thaliana, we identified a mobile copy of the Mutator-like element (MULE) with degenerated terminal inverted repeats (TIRs). This TE, named Hiun (Hi), is silent in wild-type plants, but it transposes when DNA methylation is abolished. When a Hi transgene was introduced into the wild-type background, it induced excision of the endogenous Hi copy, suggesting that Hi is the autonomously mobile copy. In addition, the transgene induced loss of DNA methylation and transcriptional activation of the endogenous Hi. Most importantly, the trans-activation of Hi depends on a Hi-encoded protein different from the conserved transposase. Proteins related to this anti-silencing factor, which we named VANC, are widespread in the non-TIR MULEs and may have contributed to the recent success of these TEs in natural Arabidopsis populations.


Conflict of interest statement

The authors declare that they have no conflict of interest.

Figures

Figure 1
Figure 1
Mobilization of Hi in ddm1 mutant. (A) Schematic diagram for structure of Hi. Terminal regions, exons, introns, and intergenic regions are shown by white bars, grey bars, grey lines, and black lines, respectively. Regions examined by bisulphite sequencing are shown by L1 and R1 with thick black lines. Region examined by McrBC-qPCR is shown by L2. Region examined for copy number quantification is shown by C1. In most of the transgene constructs, silent mutation is introduced for each ORF, so that the transcripts from the transgene and endogenous copy could be distinguished between. The sites of the silent mutations are shown by vertical bars, with surrounding arrowheads showing regions amplified by RT–PCR. Regions for ORFs deleted in each of the deletion constructs are shown by horizontal bars with two arrowheads. (B) De novo integration sites of Hi in relation to flanking transcription units. The position of integration is normalized by length of the flanking transcription unit. Rightward and leftward arrows indicate insertions with 5′ to 3′ and 3′ to 5′ orientations of Hi, respectively. Insertions flanking pseudogenes and transposon genes are shown by grey arrows, and those flanking canonical genes by black arrows. Sequences of the integration sites are shown in Supplementary Table S1. Four out of the sixty-nine insertions are not included in this figure, because they are further away from transcription units. Genomic locations of all 69 transpositions are shown in Supplementary Figure S2. (C) Excision of Hi in ddm1 plants detected by PCR. Genomic DNA of 11 ddm1 plants (lane numbers from 2 to 12) and 5 wild-type sibling plants (lane numbers from 13 to 17) was used to analyse excision of endogenous Hi by nested PCR. These lines are derived from segregating population in self-pollinated progeny of a DDM1/ddm1-1 heterozygote. Sequences of primers used are shown in Supplementary Table S2. Source data for this figure is available on the online supplementary information page.
Figure 2
Figure 2
Introduction of Hi transgene induces loss of DNA methylation and excision of endogenous Hi copy. (A) Excision of endogenous Hi induced by transgene for Hi (Hi TG: lanes 5–18). Lanes 1 and 2–4 are non-transgenic plant (wt) and transformant lines with empty vector (V) used as negative controls, respectively. Excision of Hi copy in the transgene was also detected in some of the transgenic lines (Supplementary Figure S5). (B) DNA methylation status of Hi termini in the transgenic line and progeny. T1 transformant with Hi transgene showed reduction in DNA methylation in both termini, compared to non-transgenic plant (NT) and transformants with empty vector (V). T2/TG+ and T2/TG− are self-pollinated progeny of the T1 with and without transgene, respectively. In both classes, averages and standard deviations of three segregants are shown. We also obtained essentially the same results for a segregating T3 family (Supplementary Figure S7). Regions L1 (upstream of vanA) and R1 (upstream of vanC) were examined (shown in Figure 1). At least 11 clones were examined for each plant. Source data for this figure is available on the online supplementary information page.
Figure 3
Figure 3
Transposed Hi induces loss of DNA methylation and excision of Hi in the original locus. (A) Copy number of Hi in each of the epi-RILs. The copy number was estimated by quantitative PCR using region C1 in Figure 1. Average and standard deviation of two technical replicates are shown in this and next panel. Parental origin of the original Hi locus (wt or ddm1) was determined by methylation status of the linked region (Colomé-Tatché et al, 2012). (B) DNA methylation status in the 5′ region (L2 in Figure 1) of the original Hi locus was estimated by McrBC digestion and subsequent qPCR. Details are described in Materials and methods. Hi in the original locus showed loss of DNA methylation when extra copies of Hi exist. (C) Excision analysis of original Hi copy by nested PCR. (D) Two of the epi-RILs showed germinal transmission of the excised Hi allele. Origin of the Hi locus is wild-type DDM1 for line 166 and ddm1 mutant for line 458. Presence of Hi in the original locus was examined by PCR in the 5′ border of Hi (the primer sequences are shown in Supplementary Table S2). Lack of the signal suggests fixation of the empty allele. Source data for this figure is available on the online supplementary information page.
Figure 4
Figure 4
DNA methylation status of endogenous Hi after introduction of Hi transgene and its deletion derivatives. For each of the deletion derivatives, averages and standard deviations of four independent transgenic plant lines are shown. WT and V are from Figure 2.
Figure 5
Figure 5
Trans-activation by Hi transgene without putative transposase. (A) Excision of endogenous Hi induced by ΔA transgene. Lanes 1 and 2–6 are non-transgenic plant (wt) and transformant lines with empty vector (V) used as negative controls, respectively. Excision of endogenous Hi induced by ΔB and ΔC transgene is also shown below. The results using additional ΔC lines are shown in Supplementary Figure S9. (B) Transcriptional activation of vanA induced by ΔA transgene. Materials for the same lane number in (A) and (B) are from the same plant, although the DNA and RNA are prepared from different leaves. Source data for this figure is available on the online supplementary information page.
Figure 6
Figure 6
Expression of vanC is sufficient for the trans-activation. (A) Excision of endogenous Hi induced by ΔAB transgene. (B) Transcriptional activation of vanA and vanB genes induced by ΔAB transgene. Materials for the same lane number in (A) and (B) are from the same plant, although the DNA and RNA are prepared from different leaves. (C) Excision of endogenous Hi induced by ΔAB transgene in the T2 generation. T2 plants from self-pollinated progeny of a T1 (the plant shown in lane 9 of A) were examined after determining the presence/absence of the transgene. Source data for this figure is available on the online supplementary information page.
Figure 7
Figure 7
Evolution and proliferation of TIR and non-TIR MULE families. (A) Phylogenetic relationship among MULE families in genomes of A. thaliana and A. lyrata. A. lyrata-specific lineages are shown by red lines. An NJ tree made by p-distance is shown. Scale bar is shown in the centre of the tree. The families containing DUF287 or Ulp1 protease domain are indicated in the parentheses. Names of VANDAL members are shown in phylogenetic tree in Supplementary Figure S10. (B) Dot-plot (Harr-plot) analyses among VANDAL families. Regions with nucleotide identities of 15 out of 20 or more are shown by dots. Copies with typical structure were chosen from VANDAL21, 17, 8, 7 and 6 families. From VANDAL21 family, one sequence each from two clusters was used. Coding regions are indicated by pointed thick lines.
Figure 8
Figure 8
Sliding window plot analyses of VANDAL21 and the most related family VANDAL17. (A) Divergence between two clusters (seven copies and three copies) of VANDAL21 family in A. thaliana. (B) Divergence between VANDAL21 copies in A. thaliana (three copies, which are orthologous to the A. lyrata copies) and A. lyrata (six copies). (C) Divergence between VANDAL17 family in A. thaliana (four copies) and A. lyrata (three copies). Level of divergence for synonymous and non-synonymous sites in a 200-bp window was plotted in 1 bp intervals. Only coding sequences of complete structures were used. Thin lines and thick lines indicate synonymous and non-synonymous divergences, respectively.
Figure 9
Figure 9
Demethylation of VANDAL21 members induced by Hi transgene. (A) Effects of Hi transgene on DNA methylation in TEs. Changes in methylation at CpHpG sites and CpHpH sites are plotted. For each of them, significance of decrease in methylation was accessed by the value formula image
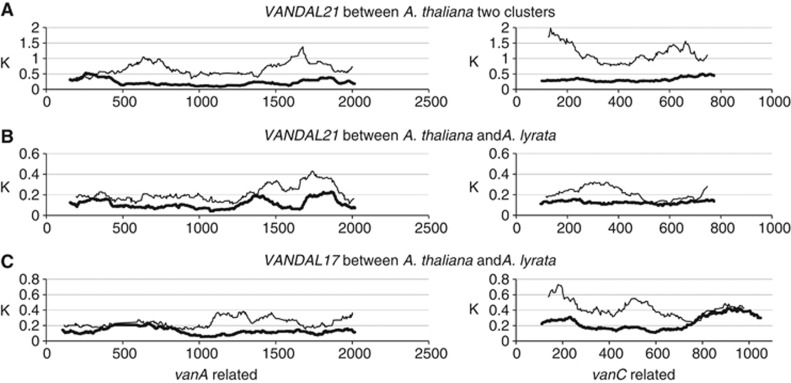
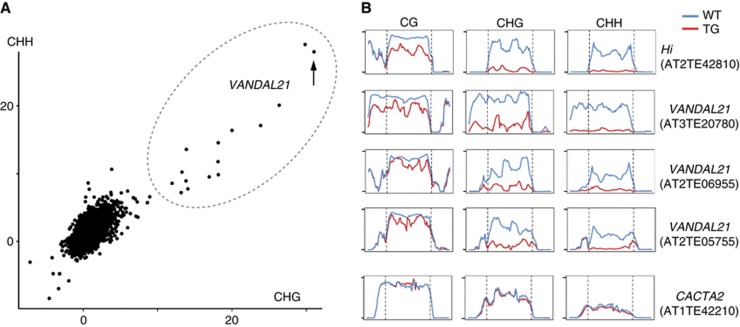
, where Mn, Cn, Mt and Ct are methylated cytosine (M) and total cytosine (C) counts mapped for each TE in the non-transgenic (n) and transgenic (t) plants, respectively. Each of these values is shown in Supplementary Table S3, with the corresponding values for CpG sites. This figure contains 24 282 TEs plotted, while 6910 TEs are not plotted due to lack of mapped cytosine in one or more of the three contexts in non-transgenic or transgenic plant. The lack is mainly because we did not use reads mapped multiple loci. Some of the VANDAL21 family members (surrounded by broken ellipse) showed most significant reduction for both CpHpG and CpHpH sites. The dot for Hi is indicated by an arrow. Similar analyses done on genes are shown in Supplementary Figure S12. (B) Effect of Hi transgene on DNA methylation across each of the VANDAL21 members. Left and right terminals are shown by broken lines for each element. Each point represents proportion of methylated cytosine for a sliding window with seven fractions after separating each TE for 100 fractions. Right and left flanking regions are also analysed by the same conditions. Scale bars for CpG, CpHpG, and CpHpH sites in each panel indicate 1, 0.8, and 0.4, respectively. For some of the VANDAL21 copies, reduced methylation in the terminal region is also confirmed by conventional bisulphite sequencing using primers within and flanking the TE (Supplementary Figure S13). Results of DNA methylation across six additional VANDAL21 members are shown in Supplementary Figure S14. CACTA2 is shown as a negative control.

References

    1. Bivalkar-Mehla S, Vakharia J, Mehla R, Abreha M, Kanwar JR, Tikoo A, Cahuhan A (2011) Viral RNA silencing suppressors (RSS): novel strategy of viruses to ablate the host RNA interference (RNAi) defense system. Virus Res 155: 1–9 - PMC - PubMed
    1. Brettell RI, Dennis ES (1991) Reactivation of a silent Ac following tissue culture is associated with heritable alterations in its methylation. Mol Gen Genet 229: 365–372 - PubMed
    1. Brown WE, Robertson DS, Bennetzen JL (1989) Molecular analysis of multiple Mutator-derived alleles of the Bronze locus of maize. Genetics 122: 439–445 - PMC - PubMed
    1. Brown J, Sundaresan V (1992) Genetic study of the loss and restoration of Mutator transposon activity in maize: evidence against dominant-negative regulator associated with loss of activity. Genetics 130: 889–898 - PMC - PubMed
    1. Buisine N, Quesneville H, Colot V (2008) Improved detection and annotation of transposable elements in sequenced genomes using multiple reference sequence sets. Genomics 91: 467–475 - PubMed

Publication types

LinkOut - more resources