. 2013 Aug;140(16):3423-34.
doi: 10.1242/dev.095083.

Essential role for ligand-dependent feedback antagonism of vertebrate hedgehog signaling by PTCH1, PTCH2 and HHIP1 during neural patterning

Affiliations

Essential role for ligand-dependent feedback antagonism of vertebrate hedgehog signaling by PTCH1, PTCH2 and HHIP1 during neural patterning

Alexander M Holtz et al. Development. 2013 Aug.

Abstract

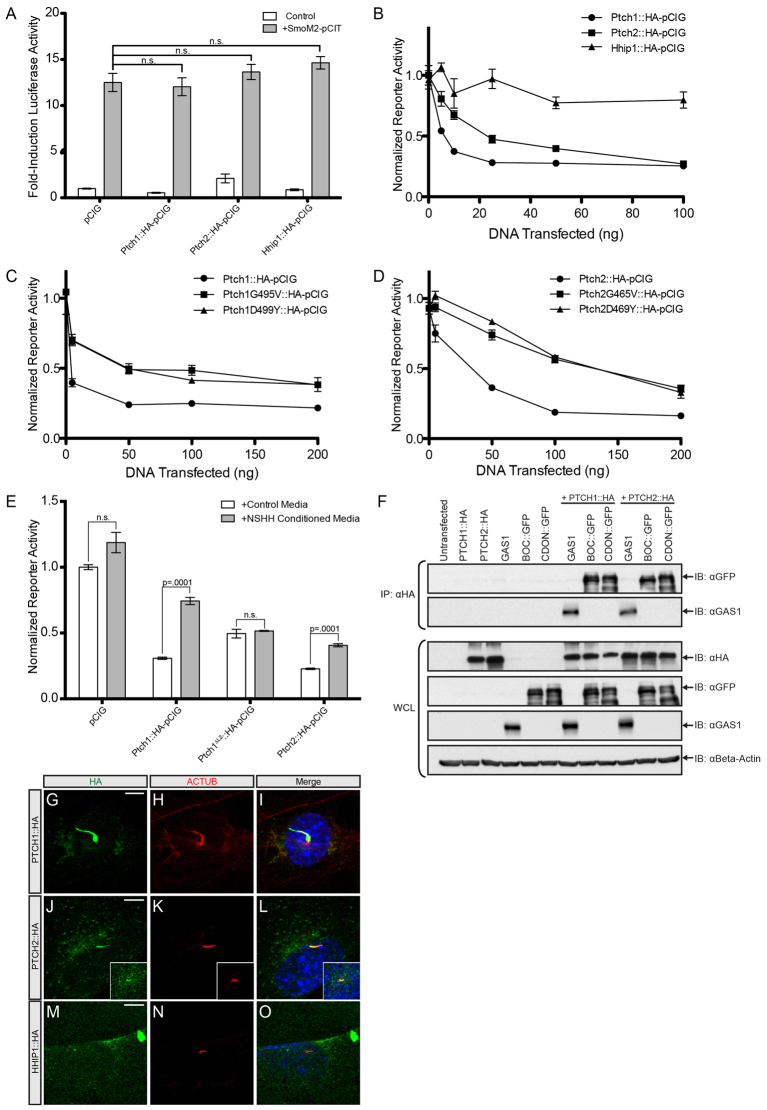
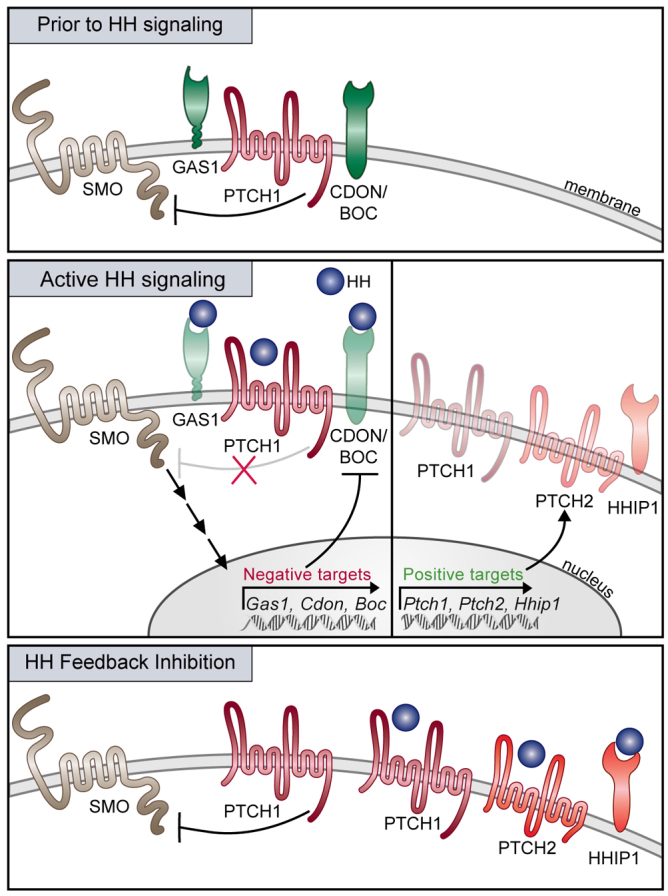
Hedgehog (HH) signaling is essential for vertebrate and invertebrate embryogenesis. In Drosophila, feedback upregulation of the HH receptor Patched (PTC; PTCH in vertebrates), is required to restrict HH signaling during development. By contrast, PTCH1 upregulation is dispensable for early HH-dependent patterning in mice. Unique to vertebrates are two additional HH-binding antagonists that are induced by HH signaling, HHIP1 and the PTCH1 homologue PTCH2. Although HHIP1 functions semi-redundantly with PTCH1 to restrict HH signaling in the developing nervous system, a role for PTCH2 remains unresolved. Data presented here define a novel role for PTCH2 as a ciliary localized HH pathway antagonist. While PTCH2 is dispensable for normal ventral neural patterning, combined removal of PTCH2- and PTCH1-feedback antagonism produces a significant expansion of HH-dependent ventral neural progenitors. Strikingly, complete loss of PTCH2-, HHIP1- and PTCH1-feedback inhibition results in ectopic specification of ventral cell fates throughout the neural tube, reflecting constitutive HH pathway activation. Overall, these data reveal an essential role for ligand-dependent feedback inhibition of vertebrate HH signaling governed collectively by PTCH1, PTCH2 and HHIP1.

Keywords: Hedgehog; Negative feedback; Neural tube.


Figures

Fig. 1.
Fig. 1.
PTCH2 is a direct transcriptional target that antagonizes HH signaling in NIH/3T3 cells and in the developing chick neural tube. (A) Ptch2 regulatory landscape highlighting two discrete GLI1 binding events positioned at -0.5 kb and +2.2 kb relative to TSS. (B) Higher magnification view of -0.5 kb region assayed for enhancer activity (blue bar). Computationally predicted GLI-binding sites (GBS) are shown in black (nonconserved) and red (conserved). Multi-species conservation (cons.) is shown below. (C) Transient transgenic analysis of Ptch2(-0.5 kb) regulatory region shows neural-specific activity at E10.5. The number of embryos expressing the transgene out of total transgenic positives is shown in the upper right-hand corner. (D) Transverse section taken from region indicated in C (black bar) shows reporter activity restricted to the ventral neural tube. (E) HH-responsive luciferase reporter activity measured in NIH/3T3 fibroblasts stimulated with either control media (white bars) or NSHH-conditioned media (grey bars), and co-transfected with the indicated constructs. Each condition was performed in triplicate and data are represented as mean±s.e.m., P-values measured by two-tailed Student’s t-test. (F-U) Hamburger-Hamilton stage 19-22 chick neural tubes electroporated with pCIG (F-I), Ptch1::HA-pCIG (J-M), Ptch2::HA-pCIG (N-Q) and Ptch1ΔL2::HA-pCIG (R-U) sectioned at the wing level and stained with antibodies raised against NKX6.1 (red, F,G,J,K,N,O,R,S) or PAX7 (red, H,I,L,M,P,Q,T,U). Nuclear EGFP expression (G,I,K,M,O,Q,S,U) labels electroporated cells. Arrows indicate repression of NKX6.1 expression (J,K,N,O,R,S) or ectopic expression of PAX7 (L,M,P,Q,T,U). Arrowheads indicate ventrally located electroporated cells that maintain NKX6.1 expression (J,K,N,O) or lack ectopic PAX7 expression (L,M,P,Q). Scale bar: 50 μm in F-U.
Fig. 2.
Fig. 2.
Normal SHH-mediated ventral neural patterning in E10.5 Ptch2-/-;Hhip1-/- mouse embryos. (A-J) Immunofluorescent analysis of neural patterning in E10.5 mouse forelimb sections detects expression of NKX6.1, DBX1, PAX3 (red, green and magenta, respectively; A-E), FOXA2, NKX2.2 and OLIG2 (red, green and magenta, respectively; F-J) in wild-type (A,F), Ptch2-/- (B,G), Hhip1-/- (C,H), Ptch2-/-;Hhip1+/- (D,I) and Ptch2-/-,Hhip1-/- (E,J) embryos. Scale bars: 50 μm.
Fig. 3.
Fig. 3.
Expansion of SHH-dependent ventral progenitor domains in E10.5 mouse embryos lacking both PTCH2- and PTCH1-feedback antagonism. (A-H) Neural patterning analysis in E10.5 forelimb sections using antibodies against NKX6.1, DBX1, PAX3 (red, green and magenta, respectively; A-D), FOXA2, NKX2.2 and OLIG2 (red, green and magenta, respectively; E-H) in wild type (A,E), MT-Ptch1;Ptch1-/- (B,F), MtPtch1;Ptch1-/-;Ptch2+/- (C,G) and MT-Ptch1;Ptch1-/-;Ptch2-/- (D,H) embryos. Insets show NKX2.2 channel alone (E-H). Arrows indicate dorsal expansion of NKX2.2+ cells in MT-Ptch1;Ptch1-/-;Ptch2-/- embryos (H). (I-K) Quantitation of FOXA2+ cell number (I), NKX2.2+ cell number (J) and NKX6.1 domain size as a % of total DV neural tube length (K). Data are represented as mean±s.e.m. calculated from at least three embryos per genotype. P-values are determined by two-tailed Student’s t-test. Scale bars: 50 μm.
Fig. 4.
Fig. 4.
Severe neural tube ventralization in E10.5 MT-Ptch1;Ptch1-/-;Ptch2-/-;Hhip1-/- embryos. (A-U) Antibody detection of NKX6.1, DBX1, PAX3 (red, green and magenta, respectively; A-D,I-L), FOXA2, NKX2.2, OLIG2 (red, green and magenta, respectively; E-H,M-P), SHH (5E1) and FOXA2 (green and red, respectively; Q-U) in E10.5 forelimb sections from wild type (A,E,I,M,Q), MT-Ptch1;Ptch1-/- (R), MT-Ptch1;Ptch1-/-;Ptch2-/- (B,F,S), MT-Ptch1;Ptch1-/-;Hhip1-/- (J,N,T), MT-Ptch1;Ptch1-/-;Ptch2-/-;Hhip1+/- (C,G), MT-Ptch1;Ptch1-/-;Hhip1-/-;Ptch2+/- (K,O) and MT-Ptch1;Ptch1-/-;Ptch2-/-;Hhip1-/- (D,H,L,P,U) embryos. Arrows indicate NKX2.2+ cells within the OLIG2 domain (F) and OLIG2+ cells in the NKX2.2 domain (G). Insets are representative of less severe phenotypes that are observed in MT-Ptch1;Ptch1-/-;Hhip1-/-;Ptch2+/- embryos (K,O). Scale bars: 50 μm.
Fig. 5.
Fig. 5.
Expansion of ventral progenitor domains occurs prior to floorplate expression of SHH in E8.5 LDA mutants. (A-O) DAPI staining (A-E) and neural patterning analysis of E8.5 embryos (9-12 somites) detects expression of NKX6.1 and PAX3 (red, green, respectively; F-J), and FOXA2 and SHH (red, green, respectively; K-O) in Ptch2-/-;Hhip1-/- (F,K), MT-Ptch1;Ptch1-/- (G,L), MT-Ptch1;Ptch1-/-;Ptch2-/- (H,M), MT-Ptch1;Ptch1-/-;Ptch2-/-;Hhip1+/- (I,N) and MT-Ptch1;Ptch1-/-;Ptch2-/-;Hhip1-/- (J,O) embryos. Arrows indicate FOXA2 expression at the dorsalmost region of the neural tube (M,N). Scale bars: 50 μm.
Fig. 6.
Fig. 6.
Overlapping and distinct mechanisms of HH pathway antagonism by PTCH1, PTCH2 and HHIP1. (A) HH-responsive luciferase reporter activity measured from NIH/3T3 fibroblasts stimulated with constitutively active SmoM2 and co-transfected with the indicated constructs. Each condition was performed in triplicate and data are represented as mean±s.e.m. (n.s., not significant, P>0.05 two-tailed Student’s t-test). (B-E) HH-responsive luciferase reporter activity measured from Ptch1-/- mouse embryonic fibroblasts (MEFs) transfected with the indicated constructs. Data are expressed as luciferase reporter activity normalized to cells transfected with empty vector alone (pCIG) and represented as mean±s.e.m. Treatment with control- (white bars) or SHH-conditioned media (grey bars) is indicated in E. (F) COS7 cells were transfected with the indicated constructs and lysates were immunoprecipitated with anti-HA antibody and blotted with anti-GFP or anti-GAS1 antibodies. (G-O) Immunofluorescent detection of HA (green; G,J,M) and acetylated tubulin (ACTUB, red; H,K,N) in NIH/3T3 cells expressing PTCH1::HA (G-I), PTCH2::HA (J-L) and HHIP1::HA (M-O). Merged images with DAPI staining (blue) shown in I,L,O. Insets show ciliary localization of PTCH2::HA in Ptch1-/- MEFs (J-L). Scale bars: 5 μm.
Fig. 7.
Fig. 7.
Model of cell-surface regulation of HH signaling. In the absence of HH ligands (top panel), PTCH1 represses SMO activity (LIA). At the onset of HH signaling (middle panel), HH binding to PTCH1 and to the obligate HH co-receptors GAS1, CDON and BOC results in de-repression of SMO function and initiation of a signal transduction cascade that culminates in GLI-mediated modulation of transcriptional targets. This initiates a negative-feedback mechanism at the cell surface that includes the downregulation of Gas1, Cdon and Boc, and upregulation of Ptch1, Ptch2 and Hhip1. PTCH1, PTCH2 and HHIP1 binding to HH ligands (bottom panel) competes with productive ligand-receptor interactions to alter the balance between bound and unbound PTCH1, resulting in cell-autonomous modulation of SMO activity. Additionally, ligand sequestration by cell-surface HH antagonists results in non-cell autonomous HH pathway inhibition in cells distal to the HH source (LDA).

References

    1. Allen B. L., Song J. Y., Izzi L., Althaus I. W., Kang J.-S., Charron F., Krauss R. S., McMahon A. P. (2011). Overlapping roles and collective requirement for the coreceptors GAS1, CDO, and BOC in SHH pathway function. Dev. Cell 20, 775–787 - PMC - PubMed
    1. Bae G.-U., Domené S., Roessler E., Schachter K., Kang J.-S., Muenke M., Krauss R. S. (2011). Mutations in CDON, encoding a hedgehog receptor, result in holoprosencephaly and defective interactions with other hedgehog receptors. Am. J. Hum. Genet. 89, 231–240 - PMC - PubMed
    1. Balaskas N., Ribeiro A., Panovska J., Dessaud E., Sasai N., Page K. M., Briscoe J., Ribes V. (2012). Gene regulatory logic for reading the Sonic Hedgehog signaling gradient in the vertebrate neural tube. Cell 148, 273–284 - PMC - PubMed
    1. Briscoe J., Sussel L., Serup P., Hartigan-O’Connor D., Jessell T. M., Rubenstein J. L., Ericson J. (1999). Homeobox gene Nkx2.2 and specification of neuronal identity by graded Sonic hedgehog signalling. Nature 398, 622–627 - PubMed
    1. Briscoe J., Pierani A., Jessell T. M., Ericson J. (2000). A homeodomain protein code specifies progenitor cell identity and neuronal fate in the ventral neural tube. Cell 101, 435–445 - PubMed

Publication types

MeSH terms