. 2013 Sep 20;288(38):27327-27342.
doi: 10.1074/jbc.M113.497826. Epub 2013 Jul 30.

A physiologically required G protein-coupled receptor (GPCR)-regulator of G protein signaling (RGS) interaction that compartmentalizes RGS activity

Affiliations

A physiologically required G protein-coupled receptor (GPCR)-regulator of G protein signaling (RGS) interaction that compartmentalizes RGS activity

Wayne Croft et al. J Biol Chem. .

Abstract

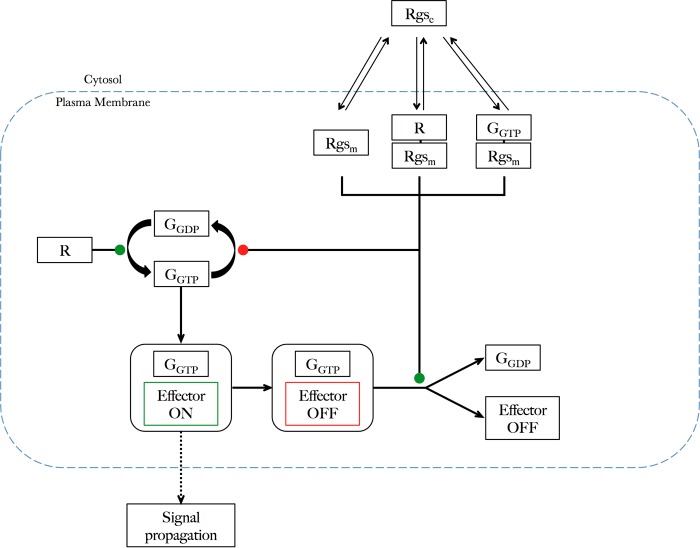
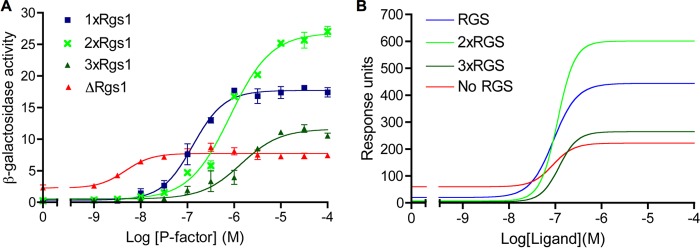
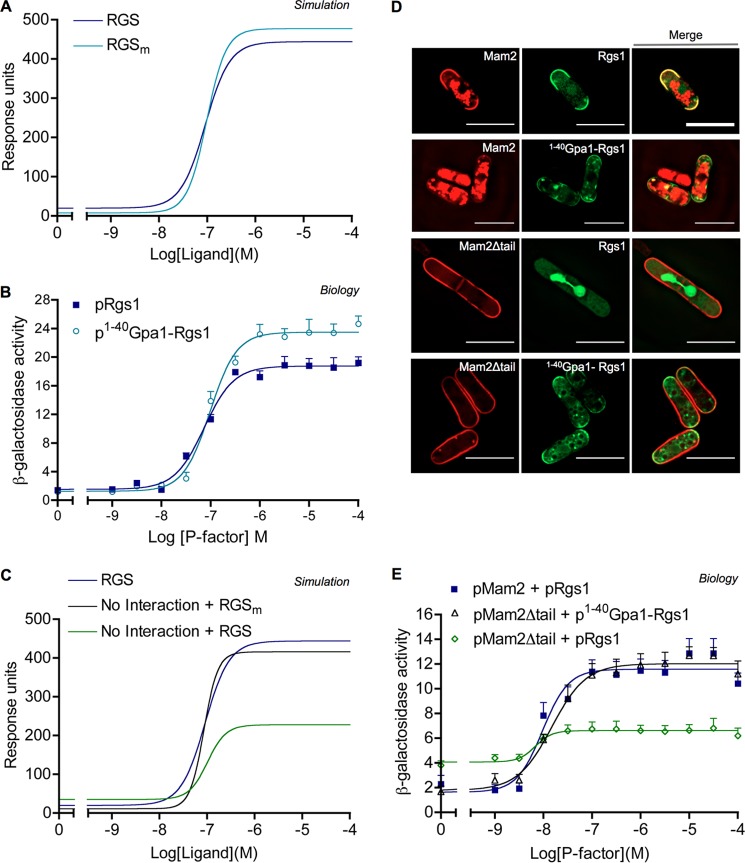
G protein-coupled receptors (GPCRs) can interact with regulator of G protein signaling (RGS) proteins. However, the effects of such interactions on signal transduction and their physiological relevance have been largely undetermined. Ligand-bound GPCRs initiate by promoting exchange of GDP for GTP on the Gα subunit of heterotrimeric G proteins. Signaling is terminated by hydrolysis of GTP to GDP through intrinsic GTPase activity of the Gα subunit, a reaction catalyzed by RGS proteins. Using yeast as a tool to study GPCR signaling in isolation, we define an interaction between the cognate GPCR (Mam2) and RGS (Rgs1), mapping the interaction domains. This reaction tethers Rgs1 at the plasma membrane and is essential for physiological signaling response. In vivo quantitative data inform the development of a kinetic model of the GTPase cycle, which extends previous attempts by including GPCR-RGS interactions. In vivo and in silico data confirm that GPCR-RGS interactions can impose an additional layer of regulation through mediating RGS subcellular localization to compartmentalize RGS activity within a cell, thus highlighting their importance as potential targets to modulate GPCR signaling pathways.

Keywords: Cell Compartmentation; Cell Signaling; G Protein-coupled Receptors (GPCR); GTPase; Kinetics; Mathematical Modeling; RGS Proteins; Signal Transduction.


Figures

FIGURE 1.
FIGURE 1.
The C-terminal tail of Mam2 interacts with Rgs1 to mediate its plasma membrane localization and functionality. A, illustration of the C-terminal tail of Mam2, indicating sites of truncation and the experimentally determined Rgs1 binding domain. B, signaling profile of Mam2Δtail compared with GTPase-deficient strains. P-factor-dependent transcription of β-galactosidase was measured from strains expressing full-length Mam2 (pMam2), strains expressing Mam2 truncated for its C-terminal tail (pMam2Δtail), strains deleted for rgs1Rgs1), and strains expressing a GTPase-deficient Gpa1 mutant (pGpa1R218C). C, signaling activity of strains expressing Rgs1 (WT), strains deleted for rgs1Rgs1), strains deleted for Pmp1 (ΔPmp1), and double deletion strains lacking Rgs1 and Pmp1 (ΔRgs1ΔPmp1) or lacking Rgs1 and Gap1 (ΔRgs1ΔGap1). D, mating efficiencies of Mam2Δtail compared with GTPase-deficient strains. Wild-type non-sterile P cells were mated with wild-type, ΔMam2, pMam2Δtail, ΔRgs1, and pRgs1 non-sterile M cells. Efficiency is quantified as the mean ± S.E. (error bars) percentage of colony-forming units recovered from three independent experiments. Significant difference from wild type is determined by unpaired t test. E, representative ΔMam2ΔRgs1 cells co-transformed with Rgs1-GFP and Mam2/Mam2Δtail fused in-frame to mCherry and expressed from the nmt1 promoter. Scale bar, 10 μm. F, comparative signaling profiles of Mam2Δtail and Mam2Δtail-mCherry, Rgs1, and Rgs1-GFP as measured using P-factor-dependent transcription of β-galactosidase. G, signaling profiles of strains expressing Mam2 with increasing portions of the C-terminal tail truncated. Results from B, C, and E are means ± S.E. of triplicate determinations.
FIGURE 2.
FIGURE 2.
Two N-terminal DEP domains are cooperatively required for plasma membrane localization and function of Rgs1. A, illustration of the domains within Rgs1. The N terminus (residues 1–344) contains two DEP domains (DEPA and DEPB), and the C terminus (residues 345–481) contains the RGS domain. The inactivating N420A mutation lies within the RGS domain. B, signaling activity of isolated Rgs1 domains and an Rgs1 mutant incapable of catalyzing GTP hydrolysis on Gpa1. P-factor-dependent transcription was measured from ΔRgs1 cells transformed to express Rgs1 truncated variants: N terminus (pN-Rgs1), C terminus (pC-Rgs1), and inactive Rgs1 (pRgs1N420A). C, investigating the influence of individual DEP domains on Rgs1 signaling activity. P-factor-dependent transcription was measured from ΔRgs1 cells expressing Rgs1N420A or Rgs1 lacking DEPA (pRgs1ΔDEPA) or DEPB (pRgs1ΔDEPB). Results from B and C are means ± S.E. (error bars) of triplicate determinations. D, expression of each GFP-Rgs1 variant. Immunoblotting of the GFP-Rgs1 fusions was confirmed using an anti-GFP monoclonal antibody. E, representative ΔMam2ΔRgs1 cells co-transformed with Mam2 fused at its C terminus to mCherry and Rgs1 variants fused at their C terminus to GFP, both expressed from separate nmt1 promoters. Scale bar, 10 μm.
FIGURE 3.
FIGURE 3.
Rgs1 can regulate signal transduction both in the absence of interaction with Mam2 and when in complex with Mam2. A, basal signaling activity of ΔMam2 strains with increasing concentrations of Rgs1. P-factor-independent transcription was measured in strains lacking endogenous rgs1Rgs1), expressing one copy of rgs1 from the nmt1 promoter (1× Rgs1), expressing two copies from nmt1 promoters (2× Rgs1), and expressing rgs1 from its endogenous promoter plus two copies from nmt1 promoters (3× Rgs1). Insets, representative cells expressing Gpa1 fused at its C terminus to GFP and ΔMam2ΔRgs1 cells transformed with Rgs1-GFP. Scale bar, 10 μm. B, basal signaling activity of ΔMam2 strains with increasing concentrations of the C-terminal RGS domain-containing region of Rgs1 (C-Rgs1). P-factor-independent transcription was measured in strains lacking endogenous rgs1Rgs1), expressing one copy of c-rgs1 from the nmt1 promoter (1× C-Rgs1), expressing two copies from nmt1 promoters (2 × C-Rgs1), and expressing c-rgs1 from its endogenous promoter plus two copies from nmt1 promoters (3× C-Rgs1). C, basal activity of ΔMam2 strains with increasing concentrations of the N-terminal, DEP domain-containing region of Rgs1 (N-Rgs1). Results in A, B, and C are means ± S.E. of triplicate determinations, and significant difference from ΔRgs1 is determined. D, signaling activity of a Mam2-Rgs1 fusion complex. ΔMam2ΔRgs1 cells were transformed to express Mam2 fused at its C terminus to Rgs1 (pMam2-Rgs1), fused to the C-terminal RGS domain-containing region of Rgs1 (pMam2-C-Rgs1), or co-transformed with Mam2 or Mam2Δtail and Rgs1 (pMam2 + pRgs1 and pMam2Δtail + pRgs1). P-factor-dependent transcription was measured; results are means ± S.E. of triplicate determinations. E, proposed mechanisms facilitating the plasma membrane localization of Rgs1 via transient interaction with Gpa1GTP or tethered through interaction with the tail of Mam2.
FIGURE 4.
FIGURE 4.
Chemical reaction scheme; GTPase cycle with compartmentalized regulation by RGS. This is an extension to the core GTPase cycle model (22) to incorporate the spatial regulation and trafficking of RGS into membrane RGSm and non-membrane-localized RGSc species. Only the membrane-localized RGSm can influence signal transduction. L, ligand; R, receptor.
FIGURE 5.
FIGURE 5.
Schematic representation of the kinetic model describing the requirement for plasma membrane trafficking of RGS to allow RGS-mediated regulation of the GTPase cycle. The diagram represents compartmentalized RGS activity with RGS species able to transfer between the cytosol, where they are inactive (RGSc), and the plasma membrane, where they are active (RGSm). Positive influences on signal propagation are indicated by green nodes, and negative influence is indicated by a red node. RGS only regulates signal propagation through contact with GTP-bound Gα species (GGTP) when in the plasma membrane compartment. Translocation of RGSc to the plasma membrane occurs via direct contacts with the membrane, interaction with the receptor (R), or interaction with its substrate (GGTP). The core GTPase cycle (22) occurs at the plasma membrane compartment, with signal propagation being positively regulated via R promoting GGDP → GGTP exchange. Opposing this, RGSm species can promote hydrolysis of GGTP → GGDP prior to effector activation events. Propagation beyond GGTP resulting in signal transduction away from the plasma membrane is via interaction of GGTP with an effector. Following a single effector activation event, an inactive complex, GGTP-effector off, cannot propagate any further signal and requires RGSm-catalyzed hydrolysis to recycle GGDP and effector for further activation.
FIGURE 6.
FIGURE 6.
Simulations from the GTPase cycle with compartmentalized regulation by RGS model display qualitative agreement with empirically determined signaling profiles. A, simulating a lack of receptor-RGS interaction and GTPase-deficient systems. Simulations were in the presence (RGS) or absence (No RGS) of RGS activity, when receptor-RGS interaction is blocked (No R-RGS interaction, Mam2Δtail equivalent), and when Gα cannot hydrolyze GTP (GαGTP hydrolysis, Gpa1R218C equivalent). B, simulations of no RGS versus RGS with GAP activity but no receptor binding (C-RGS, C-Rgs1 equivalent), RGS lacking Gα binding (N-RGS, N-Rgs1 equivalent), and RGS lacking GAP activity (Rgs1N420A equivalent). C, simulation of receptor-independent RGS activity. Simulations were in the absence of any receptors and in the presence of no RGS and 1×, 2×, and 3× RGS concentrations. D, simulating receptor and RGS fused as a single species. Shown are simulations from a “wild-type” model (RGS) and a model lacking receptor-RGS interaction compared with simulated output from a modified model whereby free receptor and RGS are replaced with a single receptor-RGS species (R-RGS fused, Mam2-Rgs1 fusion equivalent). E, simulating Gβγ as the signal propagator. Shown is the simulated response when the signal propagator was converted from GαGTP to Gβγ in the presence/absence of RGS activity and when Gα was rendered GTPase-deficient.
FIGURE 7.
FIGURE 7.
Chemical reaction scheme; GPCR-RGS fusion. The reaction scheme described in Fig. 4 was modified such that the receptor (R) and RGS species are fused into a single RRGS species.
FIGURE 8.
FIGURE 8.
Model validation against empirical data; the influence of Rgs1 concentration. A, signaling activity of strains with varying levels of Rgs1 expression. P-factor-dependent transcription was measured from strains expressing Rgs1 as one endogenous copy (1xRgs1), expressing Rgs1 as two exogenous copies (2xRgs1), expressing Rgs1 as one endogenous copy and two exogenous copies (3xRgs1), and deleted for rgs1Rgs1). Results are the mean ± S.E. (error bars) of triplicate determinations. B, simulations are in the presence of 1×, 2×, and 3× RGS concentration and no RGS. Ligand concentration was varied over the range 0–100 μm following simulation of 16-h induction. Output from the model shows accumulation of GαGTP-effector complexes over the duration of the simulated assays.
FIGURE 9.
FIGURE 9.
Simulations predict and empirical data confirm that plasma membrane localization of RGS compensates for a lack of receptor-RGS interaction. A, simulations of a wild-type RGS versus an RGS with increased membrane localization (RGSm). B, the addition of a membrane-targeting signal to Rgs1 increases maximal signaling activity. P-factor-dependent transcription was measured from ΔRgs1 cells transformed to express Rgs1 (pRgs1) or Gpa1(1–40)-Rgs1 (p1–40Gpa1-Rgs1). C, model simulations predict that enhancement of RGS in the plasma membrane compartment will compensate for a lack of receptor-RGS interaction. Simulations are of a “wild-type” system (RGS), a system lacking Receptor-RGS interaction (No interaction + RGS), and a system lacking receptor-RGS interaction but containing RGS with increased membrane localization (No interaction + RGSm). D, representative ΔMam2ΔRgs1 cells co-transformed to express Mam2-mCherry + Rgs1-GFP, Mam2-mCherry + Gpa1(1–40)-Rgs1-GFP, Mam2Δtail-mCherry + Rgs1-GFP, or Mam2Δtail-mCherry + Gpa1(1–40)-Rgs1-GFP. Scale bar, 10 μm. E, P-factor-dependent signaling activity of strains co-transformed with Mam2 + Rgs1, Mam2Δtail + Rgs1, and Mam2Δtail + Gpa1(1–40)-Rgs1. Results in B and C are means ± S.E. (error bars) of triplicate determinations.

References

    1. Elliott C. M., Stinner B., Venkataraman C. (2012) Modelling cell motility and chemotaxis with evolving surface finite elements. J. R. Soc. Interface 9, 3027–3044 - PMC - PubMed
    1. Pierce K. L., Premont R. T., Lefkowitz R. J. (2002) Seven-transmembrane receptors. Nat. Rev. Mol. Cell Biol. 3, 639–650 - PubMed
    1. Sprang S. R. (1997) G proteins, effectors and GAPs. Structure and mechanism. Curr. Opin. Struct. Biol 7, 849–856 - PubMed
    1. Johnston C. A., Siderovski D. P. (2007) Receptor-mediated activation of heterotrimeric G-proteins. Current structural insights. Mol. Pharmacol. 72, 219–230 - PubMed
    1. Ross E. M. (2008) Coordinating speed and amplitude in G-protein signaling. Curr. Biol. 18, R777–R783 - PMC - PubMed

Publication types

MeSH terms

Substances