. 2014 Jul;72(1):178-87.
doi: 10.1002/mrm.24900. Epub 2013 Jul 30.

Toward real-time temperature monitoring in fat and aqueous tissue during magnetic resonance-guided high-intensity focused ultrasound using a three-dimensional proton resonance frequency T1 method

Affiliations

Toward real-time temperature monitoring in fat and aqueous tissue during magnetic resonance-guided high-intensity focused ultrasound using a three-dimensional proton resonance frequency T1 method

Mahamadou Diakite et al. Magn Reson Med. 2014 Jul.

Abstract

Purpose: To present a three-dimensional (3D) segmented echoplanar imaging (EPI) pulse sequence implementation that provides simultaneously the proton resonance frequency shift temperature of aqueous tissue and the longitudinal relaxation time (T1 ) of fat during thermal ablation.

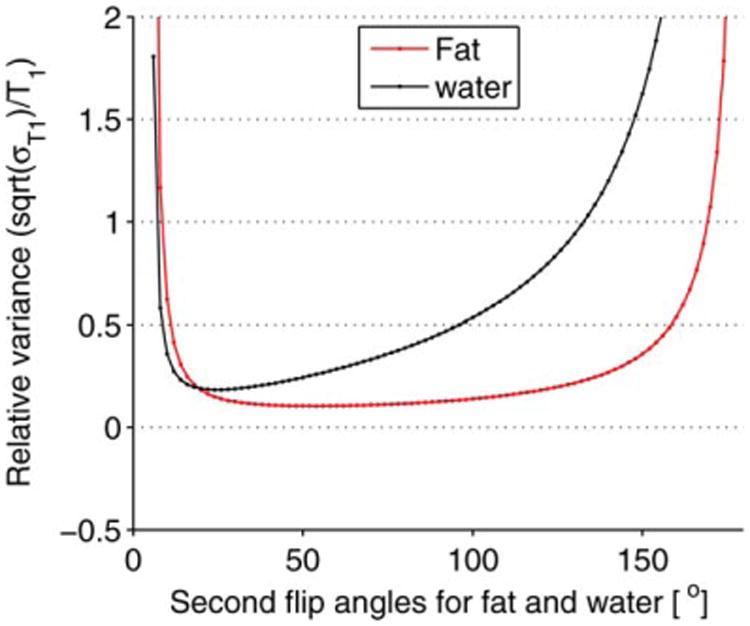
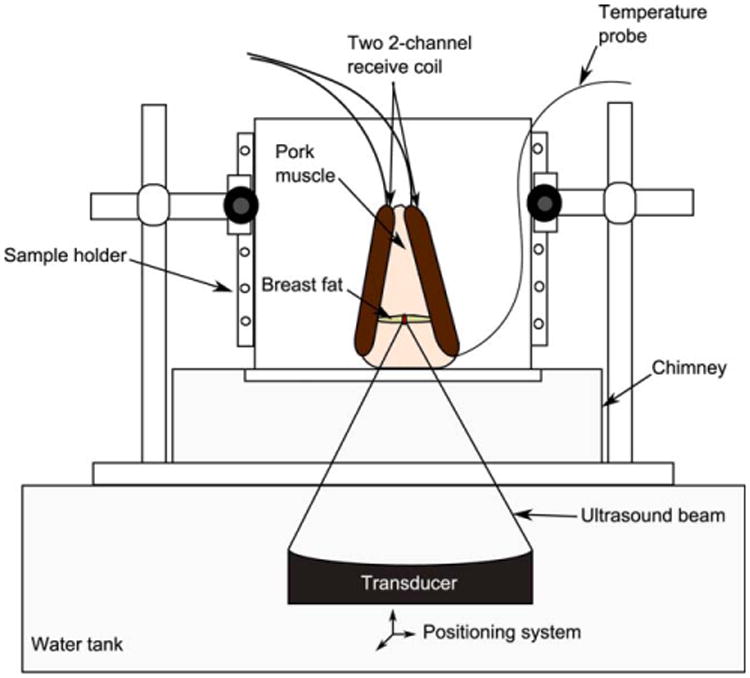
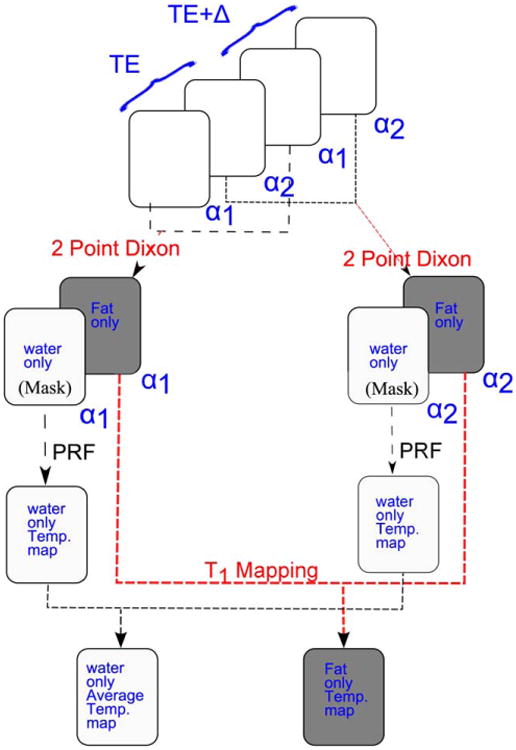
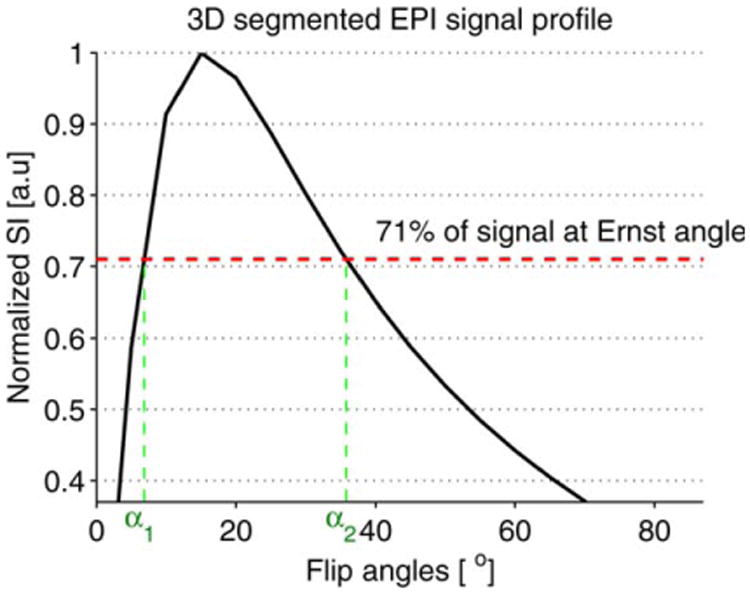
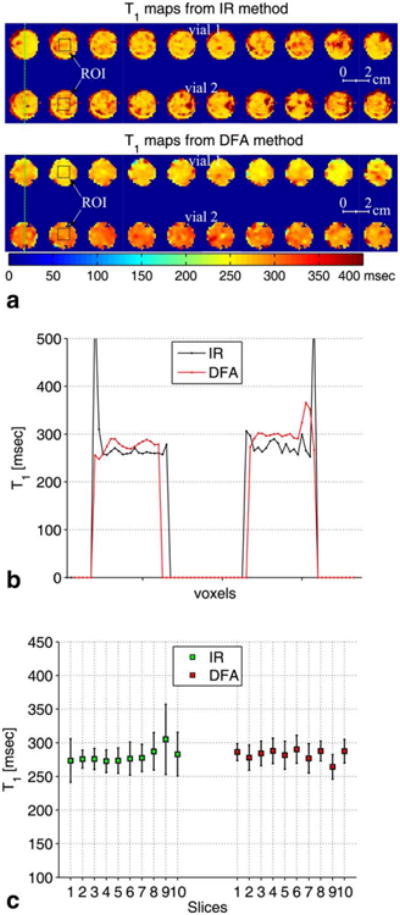
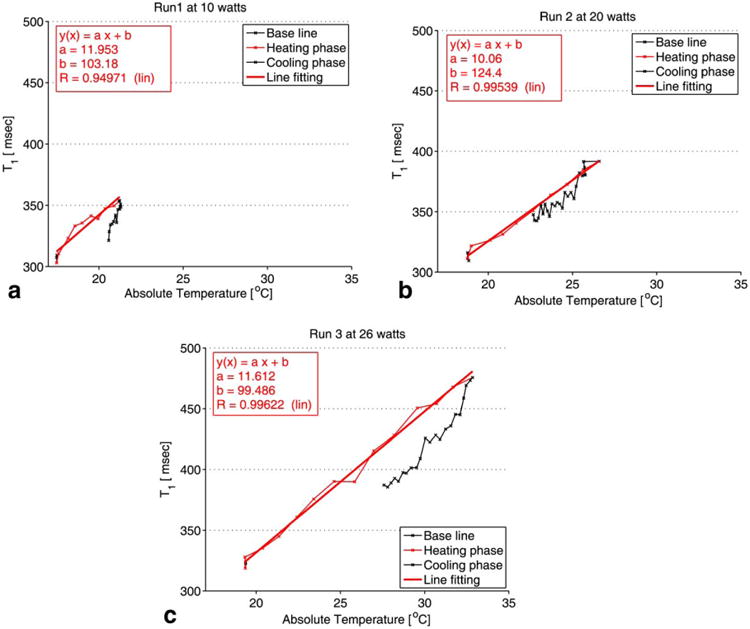
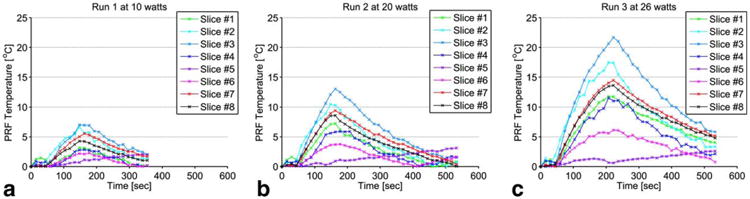
Methods: The hybrid sequence was implemented by combining a 3D segmented flyback EPI sequence, the extended two-point Dixon fat and water separation, and the double flip angle T1 mapping techniques. High-intensity focused ultrasound (HIFU) heating experiments were performed at three different acoustic powers on excised human breast fat embedded in ex vivo porcine muscle. Furthermore, T1 calibrations with temperature in four different excised breast fat samples were performed, yielding an estimate of the average and variation of dT1 /dT across subjects.

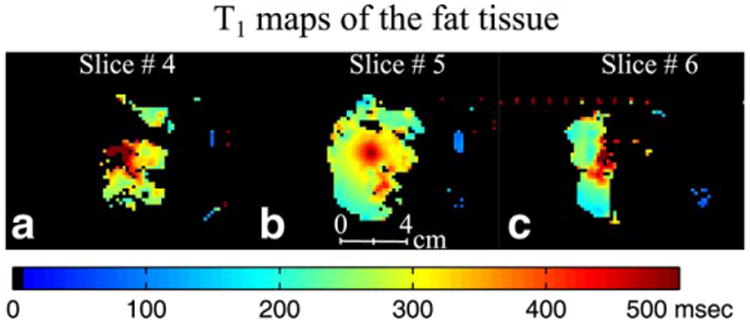
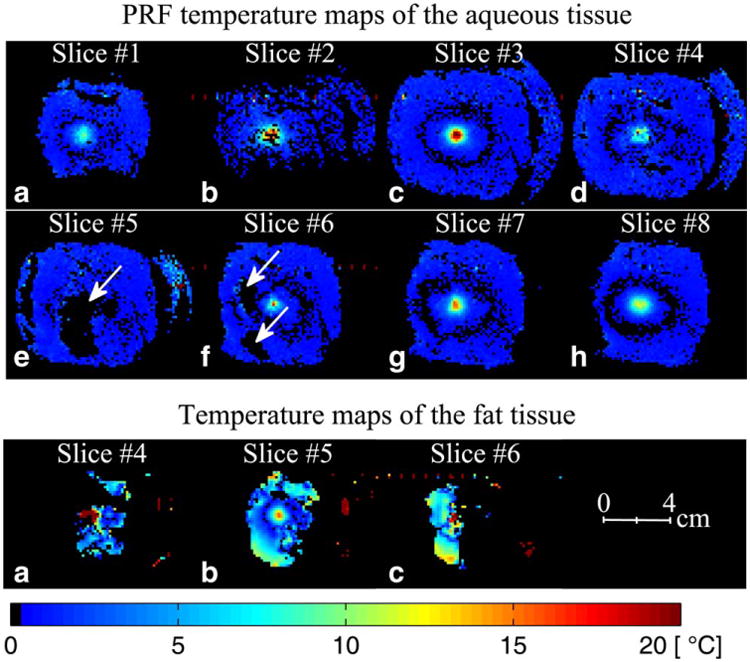
Results: The water only images were used to mask the complex original data before computing the proton resonance frequency shift. T1 values were calculated from the fat-only images. The relative temperature coefficients were found in five fat tissue samples from different patients and ranged from 1.2% to 2.6%/°C.

Conclusion: The results demonstrate the capability of real-time simultaneous temperature mapping in aqueous tissue and T1 mapping in fat during HIFU ablation, providing a potential tool for treatment monitoring in organs with large fat content, such as the breast.

Keywords: aqueous tissue; fat; temperature.


Figures

Fig. 1
Fig. 1
Simulation result of the relative variance of T1 when the two optimal flip angles of water are used to estimate T1 in mixed fat/water tissue. For the simulation, the first flip angle for fat was set equal to the first optimum flip angle of water (a1water = a1fat = 5°) and the second flip angles for fat a2fat and water a2water were found by varying the flip angles from 6° to 180° in 2° increments. The plot shows that T1 can be computed simultaneously in fat and water with minimal loss in T1 precision in fat by just using the two optimal flip angles of water.
Fig. 2
Fig. 2
Experimental setup. Human breast fat, embedded in porcine muscle, was used as a substitute for human breast. The sample was sandwiched between the two custom-built two-channel RF receiver surface coils and placed within the sample holder container. A chimney filled with degassed water ensured an acoustic beam path to the tissues sample.
Fig. 3
Fig. 3
Schematic diagram of the simultaneous fat and aqueous tissue temperature imaging using the two-point Dixon hybrid PRF-T1 acquisition method. The two temperature maps, PRF and T1, are acquired in a series of four images. Images acquired at the same flip angle are combined using the extended two-point Dixon methods to separate fat and aqueous tissues. The water-based tissue-only images are used to mask the original complex images to remove the fat signal. The phases of the aqueous tissue in regions where fat and water voxels overlapped due the chemical shift were computed using Equation [7]. A high SNR PRF temperature map was obtained by averaging over the phase maps of the two FAs. The T1 map of the fat was computed from the fat-only images using the DFA method.
Fig. 4
Fig. 4
Plot of the normalized signal intensity (SI) of the 3D segmented flyback EPI sequence versus the flip angles. The maximum T1 precision is achieved by choosing the flip angles such that SIa1=SIa2= 71% of the SI at Ernst angle αE. The plot is zoomed in to show the locations of the two optimal flip angles.
Fig. 5
Fig. 5
HIFU heating experiment results for run 2 (20 watts). T1 maps at the peak temperature of the fat in slice 4 (a), slice 5 (b), and slice 6 (c). After separating water and fat signals using the extended two-point Dixon method, the T1 maps of fat were obtained using the DFA method.
Fig. 6
Fig. 6
HIFU heating experiment results for run 2 (20 W). The top two rows show PRF temperature maps at the peak temperature of the eight coronal slices (perpendicular to the HIFU beam) of the aqueous tissue in the 3D volume. PRF temperature maps of these coronal slices were obtained by removing the fat signal using the extended two-point Dixon methods. The arrows indicate the locations of the removed fat signal. In the regions where fat and water voxels overlapped due to the chemical shift, the water phase was calculated based on the fraction of fat and water in each voxel, the fat background phase, and the resulting signal intensity in those voxels before the fat/water separation. The bottom row shows temperature maps of the fat tissue in slices 4, 5, and 6 obtained from the T1 maps in Figure 5. The temperature maps were calculated using the average T1 calibration coefficients obtained in Figure 8.
Fig. 7
Fig. 7
a: The top row shows zoomed-in T1 maps of the 10 coronal slices in ascending order of the breast fat tissue from patient 1 (see Table 1) computed using the inversion recovery (IR) method. The bottom row shows T1 maps of the same coronal slices using the DFA method. b: Line plots along the green dashed lines on the IR and the DFA T1 maps of slice 1. c: Error bar plots of the T1 maps of the 10 slices. The error bar plots show the mean and the standard deviation of T1 calculated over an ROI of 7 × 7 pixels shown by the black squares on slice 2 of the T1 maps obtained from the IR and the DFA methods.
Fig. 8
Fig. 8
T1 profile in slice 5. All measurements were performed in adipose tissue. The plot of the absolute T1 versus the temperature reading of the fiber optic temperature probe is shown for each of the three HIFU heating runs: 10W (a), 20 W (b), and 26 W (c). T1 was computed over an ROI of 2 × 2 pixels near the tip of the fiber optic temperature probe. The standard deviation of the absolute T1 change was ±5 ms.
Fig. 9
Fig. 9
(a-c) Plots of the PRF temperature versus the time of the corresponding ROI of 2 × 2 pixels described in Figure 8. All of the measurements were made in the aqueous tissue for each of the three heating runs: 10W (a), 20 W (b), and 26 W (c). The offset between the location of the fat and the water voxels due to the chemical shift was corrected while choosing the ROI in aqueous tissue.

References

    1. Hynynen K, McDannold N, Mulkern RV, Jolesz FA. Temperature monitoring in fat with MRI. Magn Reson Med. 2000;43:901–904. - PubMed
    1. Graham SJ, Bronskill MJ, Henkelman RM. Time and temperature dependence of MR parameters during thermal coagulation of ex vivo rabbit muscle. Magn Reson Med. 1998;39:198–203. - PubMed
    1. Kuroda KOK, Mulkern RV, Jolesz FA. Optimization of chemical shift selective suppression of fat. Magn Reson Med. 1996;40:505–510. - PubMed
    1. Vandeweyer E, Hertens D. Quantification of glands and fat in breast tissue: an experimental determination. Ann Anat. 2002;184:181–184. - PubMed
    1. Dimitrov IE, Douglas D, Ren J, Smith NB, Webb AG, Sherry AD, Malloy CR. In vivo determination of human breast fat composition by 1H magnetic resonance spectroscopy at 7 T. Magn Reson Med. 2012;67:20–26. - PMC - PubMed

Publication types

LinkOut - more resources