. 2015 Jul-Aug;82(7-8):548-62.
doi: 10.1002/mrd.22221. Epub 2013 Aug 26.

Polarized light microscopy in reproductive and developmental biology

Affiliations

Polarized light microscopy in reproductive and developmental biology

Maki Koike-Tani et al. Mol Reprod Dev. 2015 Jul-Aug.

Abstract

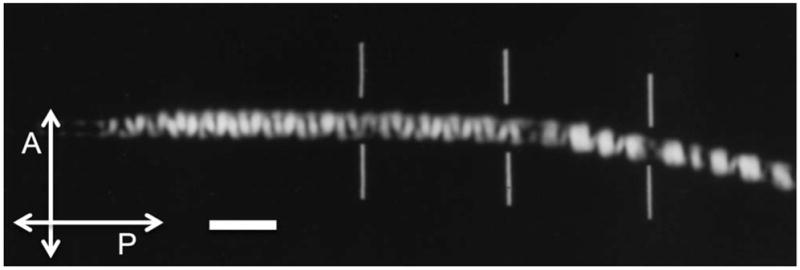
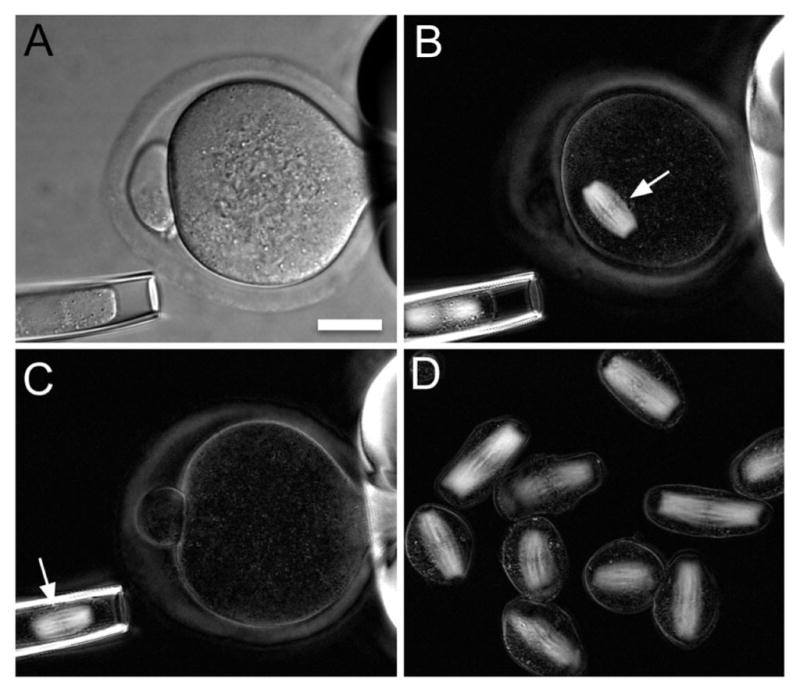
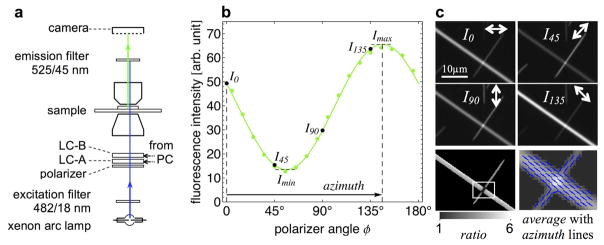
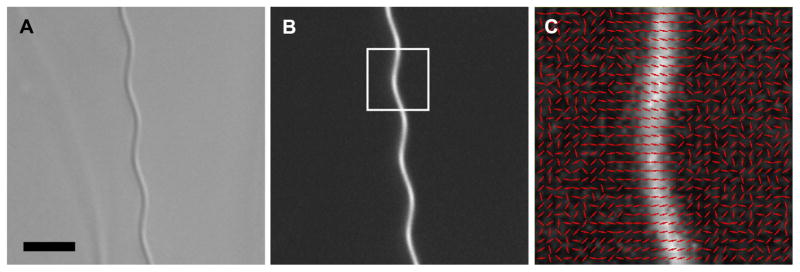
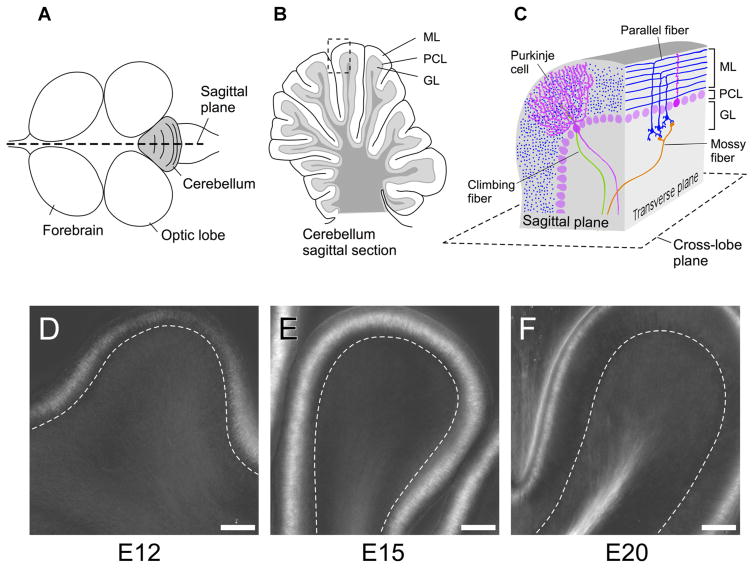
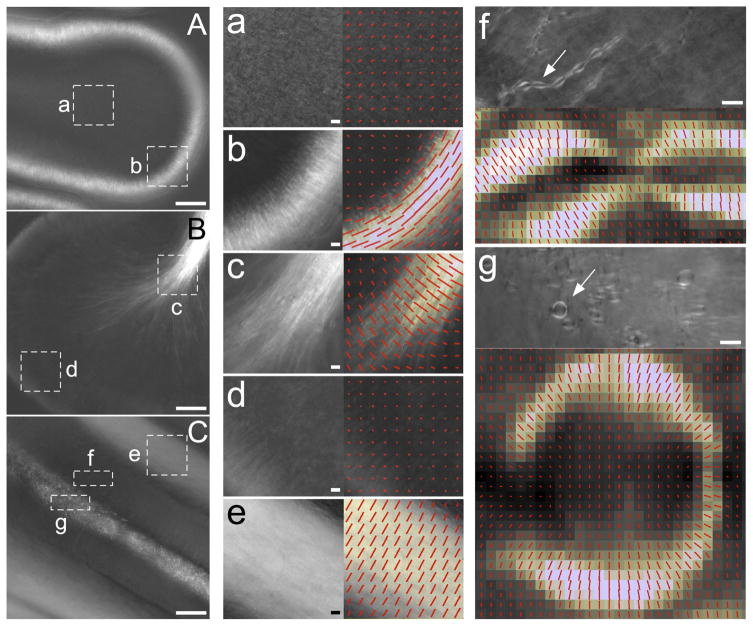
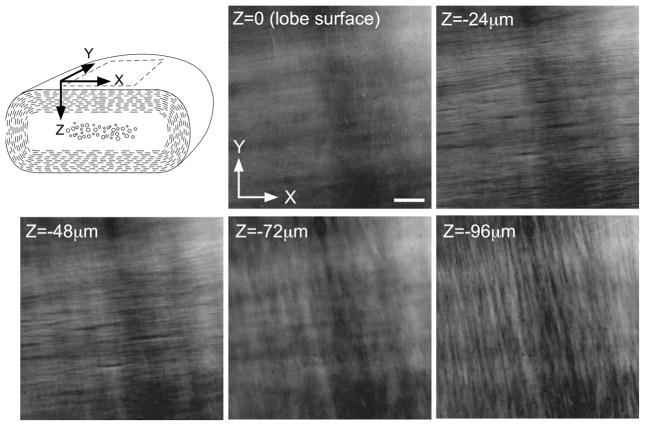
The polarized light microscope reveals orientational order in native molecular structures inside living cells, tissues, and whole organisms. It is a powerful tool used to monitor and analyze the early developmental stages of organisms that lend themselves to microscopic observations. In this article, we briefly discuss the components specific to a traditional polarizing microscope and some historically important observations on: chromosome packing in the sperm head, the first zygote division of the sea urchin, and differentiation initiated by the first asymmetric cell division in the sand dollar. We then introduce the LC-PolScope and describe its use for measuring birefringence and polarized fluorescence in living cells and tissues. Applications range from the enucleation of mouse oocytes to analyzing the polarized fluorescence of the water strider acrosome. We end with new results on the birefringence of the developing chick brain, which we analyzed between developmental stages of days 12-20.


Figures

Figure 1
Figure 1
Traditional polarized light microscope. A: Schematic optical arrangement of a conventional polarizing microscope. B: Schematic depicting, at its center, the image of an aster as it appears when located between a crossed polarizer (P) and analyzer (A). The arrows on the polarizer and analyzer sheet indicate their transmission directions. An aster is made of birefringent microtubule arrays radiating from a centrosome (aster diameter, 15 μm). Microtubules that run diagonal to the polarizer and analyzer appear bright, while microtubules that run parallel to polarizer or analyzer appear dark. C: Schematic of an aster as it appears when located between a polarizer, analyzer, and a compensator (C), which is made of a uniformly birefringent plate. The arrow in the compensator plate indicates its slow-axis direction. Microtubules that are nearly parallel to the slow axis of the compensator appear bright, while those that are more perpendicular to the slow axis are dark. Therefore, the birefringence of microtubules has a slow axis that is parallel to the polymer axis, as is the case for many biopolymers. Reprinted with permission from Oldenbourg (2013).
Figure 2
Figure 2
Cave cricket sperm head. Live sperm head of cave cricket viewed between crossed polarizers. The helical regions of the DNA, wound in a coil of coils within the chromosomes, appear bright or dark depending on their orientation with respect to the crossed polarizer (P) and analyzer (A). Bars indicate junctions of chromosomes that are packed in tandem in the needle-shaped sperm head. This is the first (and virtually only) mode of microscopy by which the packing arrangement of DNA and the chromosomes have been clearly imaged in live sperm of any species. The sperm head was immersed in dimethyl sulfoxide for index matching, and imaged with a high-resolution polarizing microscope using rectified optics (97–/1.25 NA). Scale bar, 2 μm. Figure adapted from Inoue and Sato (1966).
Figure 3
Figure 3
Sea urchin zygote first division. Birefringence of spindle, asters, and fertilization envelope in the early zygote of the sea urchin Lytechinus variegatus. a: The streak stage. After a large, weakly birefringent monaster with radially aligned, slow-axis directions disappears, its mid-region turns into a birefringent streak with a slow axis perpendicular to the streak. b: The streak is replaced by a compact birefringent spindle with a slow axis now parallel to the spindle axis. c: The spindle and astral birefringence increases as they develop further in pro-metaphase. d: In full metaphase to anaphase onset, densely packed microtubules make up the fully formed half spindles and the small but distinct amphiasters. Their birefringence reaches peak values at this stage. e: The two half-spindles lead the chromosomes pole-wards in mid-anaphase. The chromosomes are non-birefringent. f: In telophase, the half spindles and astral rays are made up of longer but less densely packed microtubules, thus exhibiting weaker birefringence. g: Early cleavage. h: Late cleavage stage. The strong birefringence of the fertilization envelope, with a slow axis parallel to its tangent, is visible in all of the panels. Scale bar, 20 μm. Micrographs reprinted with permission from Salmon and Wolniak (1990).
Figure 4
Figure 4
Sand dollar embryonic fourth division. Fourth division in the embryo of the sand dollar Echinarachnius parma. Left: The spindles have migrated to, and converged at, the vegetal pole of this eight-cell stage embryo (the four animal-pole cells are out of focus). Right: Cleavage bisecting the telophase spindle has given rise to four macromeres and four micromeres. These latter four cells form the skeletal spicules and germ cells. Scale bar, 50 μm. Reprinted with permission from Inoue (1981).
Figure 5
Figure 5
LC-PolScope. The optical design of the LC-PolScope (left) builds on the traditional polarized light microscope, with the conventional compensator replaced by two variable retarders LC-A and LC-B. The polarization analyzer passes circularly polarized light and is typically built from a linear polarizer and a quarter-wave plate. Images of the specimen (top row, aster isolated from surf clam egg, 15 μm diameter) are captured at five pre-determined retarder settings, which cause the specimen to be illuminated with circularly polarized light (first, left most image) and with elliptically polarized light of different axis orientations (second to fifth image). Based on the raw PolScope images, the computer calculates the retardance image and the slow-axis orientation or azimuth image using specific algorithms (Shribak and Oldenbourg, 2003). The false-color image on the right was created by combining the retardance and slow-axis orientation data, with the orientation encoded as hue and the retardance as brightness. Reprinted with permission from Oldenbourg (2013).
Figure 6
Figure 6
Crane fly spermatocyte. LC-PolScope images of a primary spermatocyte from the crane fly, Nephrotoma suturalis, in late metaphase. At the top left, the retardance image of the whole cell is dominated by the meiotic spindle extending between two poles and with chromosomes aligned at the metaphase plate. Regions 1, 2, and 3 are enlarged, with red lines indicating the slow-axis direction for each pixel. The underlying retardance images were enlarged using bilinear interpolation. Region 1 shows a cross section through the cell membrane in which the slow axis is oriented perpendicular to the plane of the membrane. Region 2 identifies a kinetochore with centromere and attached kinetochore fiber, with slow axes parallel to the microtubule bundles. Region 3 shows a lipid droplet with a highly birefringent shell on the right and slow axes perpendicular to the droplet’s surface. The left side of Region 3 shows parts of mitochondria that surround the meiotic spindle like a mantle of birefringent tubes, with a slow axis parallel to the tube axis. The cell was prepared and the image recorded by James R. LaFountain, University at Buffalo.
Figure 7
Figure 7
Enucleation of mouse oocytes. A: A mouse oocyte held in place by gentle suction of a holding pipette (scale bar, 20 μm; differential interference contrast microscopy). B: Retardance image of the same oocyte, showing the birefringent spindle of meiosis II (white arrow). C: The spindle (arrow) is aspirated into an enucleation pipette. D: A batch of enucleated spindles and chromosomal karyoplasts. Chromosomes are aligned in the middle of spindles. The figure is courtesy of Dr. Lin Liu (Liu et al., 2000).
Figure 8
Figure 8
Fluorescence LC-PolScope. a: Diagram of trans-illumination excitation (blue) and fluorescence emission (green) light path. The universal polarizer (linear polarizer, LC-A, and LC-B) is used to rotate the linear polarization to azimuth angles 0°, 45°, 90°, and 135°. b: Graph of fluorescence intensity measured in an image point of a GFP crystal versus the angle of linear polarization of the excitation light. Solid green circles represent measured values, the green line is the best-fit line. c: GFP crystal fluorescence I0, I45, I90, and I135 recorded using excitation light of four polarization angles. Bottom row are ratio and azimuth images computed using image arithmetic. In the right image, the average fluorescence is overlaid with blue lines indicating the azimuth orientation. The ratio and azimuth values in pixels with near-zero average fluorescence (background) are strongly affected by shot noise, and are therefore not reliable and blackened using a mask that was generated based on the average image. Reprinted with permission from DeMay et al. (2011b).
Figure 9
Figure 9
Water strider acrosome. Images of the sperm acrosome of the water strider Aquarius remigis. A: Differential interference image of a section of the acrosome, which in its entirety can be more than 2 mm long. Scale bar, 5 μm. B: Fluorescence image of the same acrosome section, revealing its intrinsic fluorescence using 470/40 nm excitation, 530/40 emission filters. C: Polarization of the endogenous fluorescence from the boxed region in (B). The orientations of the red lines indicate the prevailing polarization of the fluorescence recorded at every second pixel location of the original image. The underlying grayscale image represents the intensity ratio between maximum and minimum fluorescence (black for ratio = 1, white for ratio = 4) measured at each location. Reprinted with permission from Miyata et al. (2011).
Figure 10
Figure 10
Septin in Madin-Darby canine kidney cells. Fluorescence image of a living MDCK cell expressing septin molecules linked to GFP. The image was recorded with the Fluorescence LC-PolScope, which reveals the polarized fluorescence of septin fibers in false color. The hue in the image reports the prevailing orientation of the GFP dipoles, which in turn reflects the fiber orientation, as septin-GFP molecules are locked into the fiber assembly. Isotropic fluorescence is shown in white, such as the fluorescence of septin-GFP molecules suspended in the cytosol. The figure legend near the bottom right relates the hue to the polarization orientation indicated by black lines spaced at 45° intervals. This image was recorded by Bradley S. DeMay, Dartmouth College, Hanover NH.
Figure 11
Figure 11
Birefringence of developing chick brain slices. Anatomical structure of embryonic chick cerebellum and LC-PolScope images of brain slices from developing cerebellar cortex. A: Schematic drawing of whole brain (top view). Cerebellum is shown in gray. B: A schematic drawing of cerebellar section cut along sagittal plane. The cerebellar cortex is comprised of three layers: the Molecular Layer (ML), Purkinje Cell Layer (PCL), and Granular Layer (GL). C: Schematic illustration showing the general organization of the cerebellar cortex. Tissue section shown as a dotted square in (B) was cut in both the sagittal and transverse plane, and illustrated to show the organized structure of cerebellar cortex. We used three different planes to observe the structure of the tissue: the sagittal plane, transverse plane, and cross-lobe plane. D,E: Developmental changes of birefringent structures and their increase in retardance in chick cerebellar sagittal slices, observed with an LC-PolScope. Images of a single lobe from 250-μm thick brain slices at developmental stages E12 (D), E15 (E), and E20 (F) of the chick cerebellum. Broken lines indicate the Purkinje Cell Layer. Scale bars, 100 μm.
Figure 12
Figure 12
Birefringent structures in different regions and developmental stages of the cerebellum. A: A PolScope image of sagittal section in the middle stage of development (E15). Regions of white matter tract (a) and the molecular layer (b) are enlarged to show the details of birefringent structure (a,b, left) and the optical slowaxis of birefringence (a,b, right). B: A PolScope image of sagittal brain section in the late stage of development (E20). Regions of white matter tract (c) and the molecular layer (d) are enlarged. C: A PolScope image of a cross-lobe section of a cerebellar lobe at late stage of development (E20). Regions of the molecular layer (e), the granular layer (f) and white matter tract (g) were selected for eDetailed analysis. Tubular structures extended toward Purkinje cell layer (f, top). Structure indicated by an arrow is enlarged to indicate the slow axis (f, bottom). Round-shaped structures that appear in the white matter tract (g, top). Single, round-shaped structure indicated by an arrow is enlarged to indicate the slow axis (g, bottom). Scale bars, 100 μm (A, B, C), 10 μm (a, b, c, d, e, f, g).
Figure 13
Figure 13
LC-PolScope optical sections of an E18 cerebellar lobe. Schematic drawing of cerebellar lobe illustrating the orientation of the x, y, and z axes. Parallel fibers are shown in broken lines around the edge. Myelinated axons are shown in circles at the center of the lobe. The PolScope imaging was started from the surface of the cerebellar lobe (z =0). Scale bar, 100 μm.

References

    1. Allen RD, Brault J, Moore RD. A new method of polarization microscopic analysis I. Scanning with a birefringence detection system. J Cell Biol. 1963;18:223–235. - PMC - PubMed
    1. Bennett HS. The microscopical investigation of biological materials with polarized light. In: Jones RM, editor. McClung’s handbook of microscopical techniques for workers in animal and plant tissues. 3. New York, NY: Paul B. Hoeber, Inc., Medical Book Department of Harper & Brothers; 1950. pp. 591–677.
    1. Bromage TG, Goldman HM, McFarlin SC, Warshaw J, Boyde A, Riggs CM. Circularly polarized light standards for investigations of collagen fiber orientation in bone. Anat Rec B New Anat. 2003;274:157–168. - PubMed
    1. Byrne JA, Pedersen DA, Clepper LL, Nelson M, Sanger WG, Gokhale S, Wolf DP, Mitalipov SM. Producing primate embryonic stem cells by somatic cell nuclear transfer. Nature. 2007;450:497–502. - PubMed
    1. Chandler DE, Heuser J. The vitelline layer of the sea urchin egg and its modification during fertilization. A freeze-fracture study using quick-freezing and deep-etching. J Cell Biol. 1980;84:618–632. - PMC - PubMed

Publication types

LinkOut - more resources