. 2014 Dec;24(12):3310-21.
doi: 10.1093/cercor/bht189. Epub 2013 Jul 30.

Increased firing to cues that predict low-value reward in the medial orbitofrontal cortex

Affiliations

Increased firing to cues that predict low-value reward in the medial orbitofrontal cortex

Amanda C Burton et al. Cereb Cortex. 2014 Dec.

Abstract

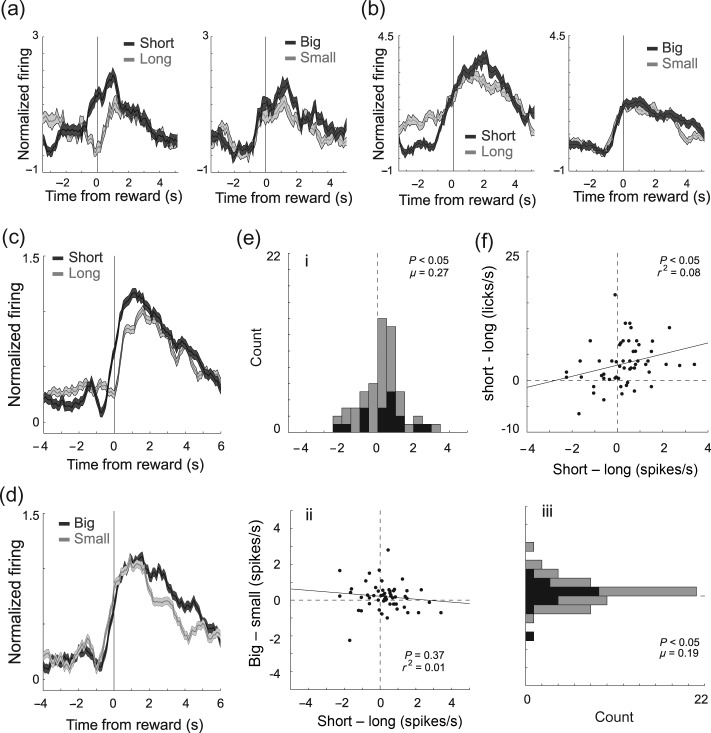
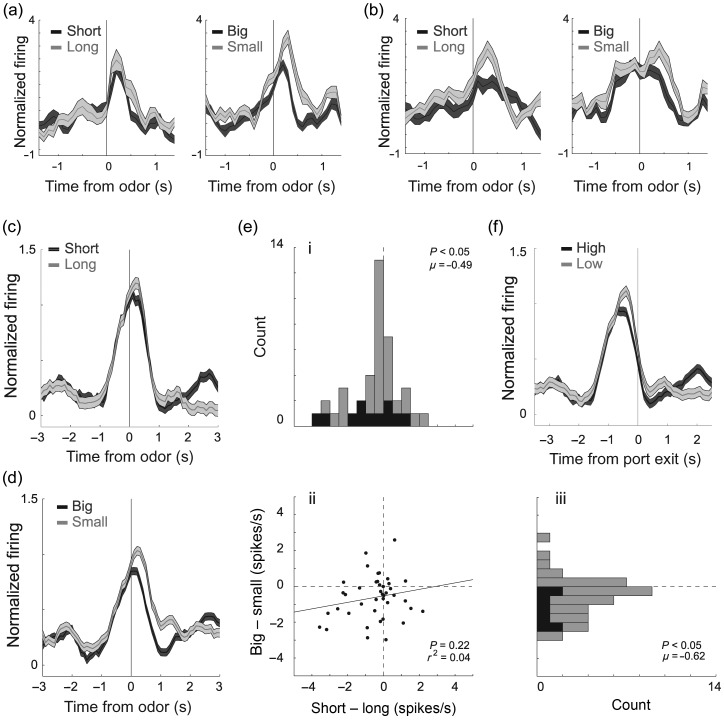
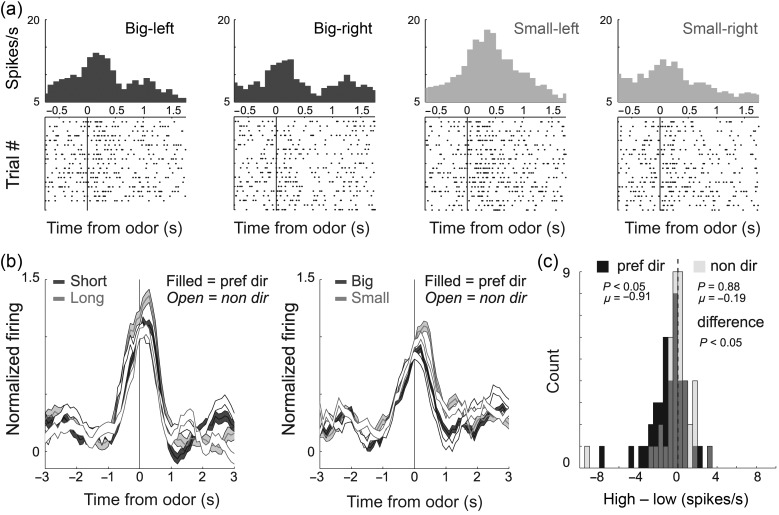
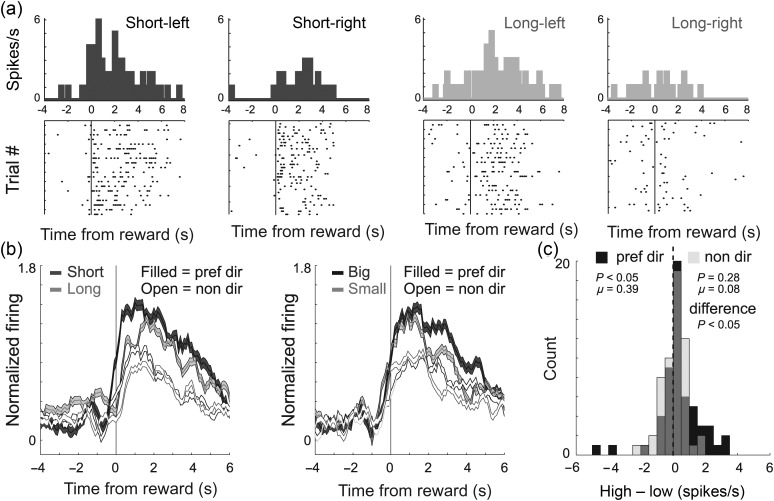
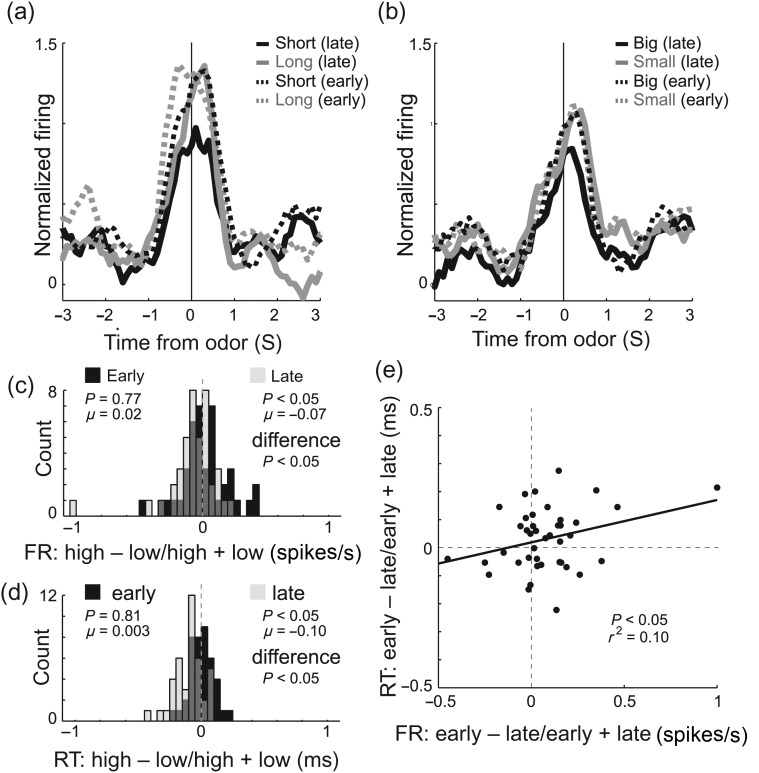
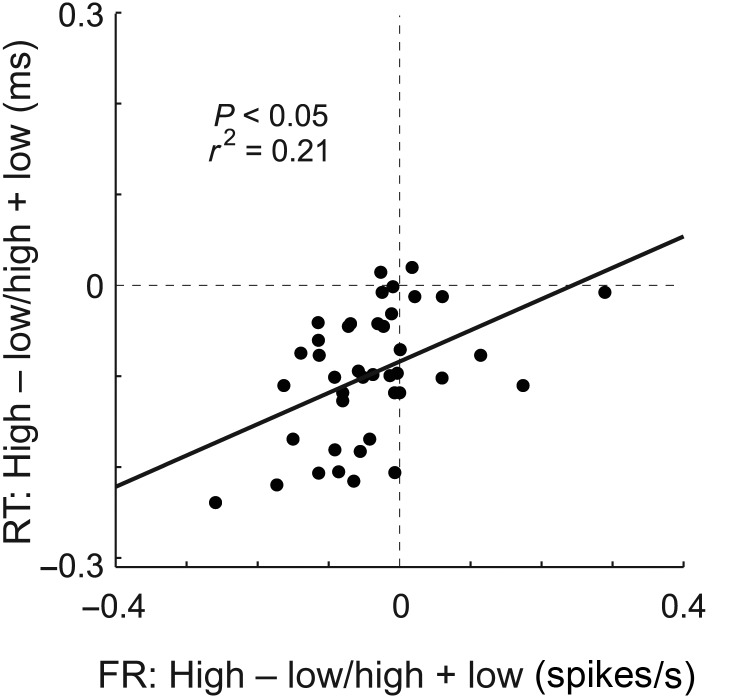
Anatomical, imaging, and lesion work have suggested that medial and lateral aspects of orbitofrontal cortex (OFC) play different roles in reward-guided decision-making, yet few single-neuron recording studies have examined activity in more medial parts of the OFC (mOFC) making it difficult to fully assess its involvement in motivated behavior. Previously, we have shown that neurons in lateral parts of the OFC (lOFC) selectively fire for rewards of different values. In that study, we trained rats to respond to different fluid wells for rewards of different sizes or delivered at different delays. Rats preferred large over small reward, and rewards delivered after short compared with long delays. Here, we recorded from single neurons in rat rostral mOFC as they performed the same task. Similar to the lOFC, activity was attenuated for rewards that were delivered after long delays and was enhanced for delivery of larger rewards. However, unlike lOFC, odor-responsive neurons in the mOFC were more active when cues predicted low-value outcomes. These data suggest that odor-responsive mOFC neurons signal the association between environmental cues and unfavorable outcomes during decision making.

Keywords: discounting; inhibition; orbitofrontal cortex; prediction; reward; single unit; value.


Figures

Figure 1.
Figure 1.
Task, behavior, and recording sites. (a) The sequence of events in each trial block. For each recording session, one fluid well was arbitrarily designated as short (a short 500-ms delay before reward) and the other designated as long (a relatively long 1- to 7-s delay before reward) (Block 1). After the first block of trials (∼60 trials), contingencies unexpectedly reversed (Block 2). With the transition to Block 3, the delays to reward were held constant across wells (500 ms), but the size of the reward was manipulated. The well designated as long during the previous block now offered 2–3 fluid boli, whereas the opposite well offered 1 bolus. The reward stipulations again reversed in Block 4. (b) The impact of delay length (right) and reward size (left) manipulations on choice behavior during free-choice trials. (c) Impact of value on forced-choice trials for short versus long delay (left) and big versus small rewards (right). (d) Reaction times (odor offset to nose unpoke from odor port) on forced-choice trials (expressed in ms) comparing short- versus long-delay trials and big- versus small-reward trials. Only rats that contributed to the neural dataset were included in the behavioral analysis (b–d; n = 5). (e) Location of recording sites. Filled gray boxes mark the locations of electrodes based on histology. Electrode wires were housed in a 27-G cannula. Shown are representative slices of 4.7-, 4.2-, and 3.7-mm coronal sections anterior to bregma from Paxinos and Watson (1997). The center of the majority of recording electrodes fell in between 4.2 and 4.7 mm anterior to bregma. One electrode was more anterior, centered roughly at 4.5–4.7 mm anterior to bregma. Rats were excluded from analysis if the electrode track crossed the plane at which the forceps minor corpus callosum became visible to avoid the contribution of more posterior medial prefrontal cortical regions (∼3.7). Open gray boxes represent recording sites excluded due to being too lateral or too posterior. Asterisks indicate planned comparisons revealing statistically significant differences (t-test, P < 0.05). Error bars indicate standard errors of the mean (SEMs). Prl: prelimbic; MO: medial orbital; VO: ventral orbital; LO: lateral orbital; DLO: dorsolateral orbital; AI: agranular insular.
Figure 2.
Figure 2.
Reward-related activity in the OFC was stronger for an immediate and large reward. (a–d) Histograms representing the activity of single cells (a–b) and across the population (c–d) of reward-responsive neurons (n = 56; 22%) in the mOFC during task performance of delay (dark gray = short; light gray = long) and size (dark gray = big; light gray = small) blocks. Activity is aligned to reward delivery (time zero). For short, big, and small trials, well entry occurred 500 ms before reward delivery. On long-delay trials, well entry was 1–7 s before reward delivery. Neurons were selected by comparing activity during the reward epoch when compared with baseline (see text; t-test; P < 0.05). Activity is normalized by subtracting the mean and dividing by the standard deviation (z-score). Bins are 100 ms. Thickness of line reflects standard error of the mean (SEM). Note that activity that precedes the 500 ms before reward delivery for rewards that were delivered after a short delay (short, big, and small) cannot be directly compared with activity that precedes 500 ms before reward delivery on long-delay trials, because task events (well entry, port exit, etc.) occur at different time points across these trial types. (e) Correlation (ii) between difference scores for size and delay blocks (i.e., short minus long (i) and large minus small (iii)). Neural activity was taken during the reward epoch. Black bars in distribution histogram represent neurons that showed a significant difference between differently valued outcomes (P < 0.05; main or interaction effect of value in a 2-factor ANOVA; reward epoch). (f) Correlation between value indices for the licking rate in anticipation of reward (250 ms before reward delivery) and for the firing rate during the reward epoch (1 s after reward) on short- and long-delay trials (short-long). All data are taken from forced-choice trials.
Figure 3.
Figure 3.
Odor-evoked activity in the OFC was stronger for cues that predict long delay and small reward. (a–d) Histograms representing the activity of single cell (a–b) and across the population (c–d) of odor-responsive neurons (n = 41; 16%) in the mOFC during task performance of delay (dark gray = short; light gray = long) and size (dark gray = big; light gray = small) blocks aligned to odor onset. For short, big, and small trials reward occurred several seconds later. This included the 500 ms of odor delivery and prefluid delay plus the intervening time taken to respond to the odor and move to the odor port. On long-delay trials, reward occurred an additional 0.5–6.5 s later, thus cannot be examined in this figure. (e) Correlation (ii) between difference scores for size and delay blocks [i.e., short minus long (i) and large minus small (iii)]. Activity was taken during the odor epoch (100 ms after odor onset to odor port exit). Black bars in distribution histogram represent neurons that showed a significant difference between differently valued outcomes (P < 0.05; main or interaction effect of value in a 2-factor ANOVA; odor epoch). (f) Activity is aligned to odor port exit to show that differences in activity between high- and low-value outcomes was not a product of different reaction times. Neurons were selected by comparing activity during the odor epoch with baseline (1 s before nosepoke; t-test; P < 0.05). Activity is normalized by subtracting the mean and dividing by the standard deviation (z-score). Bins are 100 ms. Thickness of line reflects standard error of the mean (SEM). All data are taken from forced-choice trials.
Figure 4.
Figure 4.
Odor-responsive neurons in the mOFC were directionally selective. (a) Activity of a single cell during size blocks demonstrating higher firing when odor cues predicted a small reward on the left. (b) Average firing rate over all 41 odor-responsive neurons broken down by preferred and nonpreferred response direction. Preferred direction was defined for each cell by determining which trial type elicited the strongest firing. Filled = preferred direction; open = nonpreferred direction; dark gray = high value (short and big); light gray = low value (long and small). Activity is normalized by subtracting the mean and dividing by the standard deviation (z-score). Bins are 100 ms. Thickness of line reflects standard error of the mean (SEM). (c) Distribution of value indices taken during the odor epoch (see Methods) independently for preferred (black) and nonpreferred response directions (light gray). Light gray distributions are transparent, and dark gray thus indicates where black (preferred) and light gray (nonpreferred) overlap. The Wilcoxon test were used to determine whether the 2 distributions were significantly different from zero and from each other (P < 0.05).
Figure 5.
Figure 5.
Reward-responsive neurons in the mOFC were directionally selective. (a) Activity of a single cell during delay blocks demonstrating higher firing during short- versus long-delay trials at the time of reward delivery. (b and c) Same as bc in Figure 4, except for the 56 reward-responsive neurons (reward epoch).
Figure 6.
Figure 6.
Emergence of cue selectivity during learning. (a and b) Population activity for the 41 odor-responsive neurons for responses made in the preferred direction, averaged over free- and forced-choice trials, for delay (a) and size (b) blocks. For each trial type, the average of the first (dashed) and last (solid) 5 trials in a block are shown. Black = short or large; gray = long or small. (c) Distribution of value indices (high − low/high + low) reflecting the firing rate (odor epoch) difference between high- and low-value outcomes, early (first 5 trials; black) and late (last 5 trials; late) during learning. (d) Distribution of value indices (high − low/high + low) reflecting the reaction time difference between high- and low-value outcomes, early (first 5 trials; black) and late (last 5 trials; late) during learning. (e) Scatter plot represents the correlation between changes in firing and in reaction time that occur during learning (early − late/early + late) on high-value reward trials. FR: firing rate; RT: reaction time. The Wilcoxon test were used to determine whether the 2 distributions were significantly different from zero and from each other (P < 0.05).
Figure 7.
Figure 7.
Correlation between reaction time (RT) and firing rate (FR) collapsed across both value manipulations. Scatter plot represents the correlation between high- and low-value trial-type differences for reaction time (odor offset to odor port exit) and neural firing (odor epoch) averaged across value manipulation and direction. Value index = high − low/high + low.

References

    1. Bechara A, Damasio H, Damasio AR. Emotion, decision making and the orbitofrontal cortex. Cereb Cortex. 2000;10:295–307. - PubMed
    1. Berlin HA, Rolls ET, Kischka U. Impulsivity, time perception, emotion and reinforcement sensitivity in patients with orbitofrontal cortex lesions. Brain. 2004;127:1108–1126. - PubMed
    1. Bouret S, Richmond BJ. Ventromedial and orbital prefrontal neurons differentially encode internally and externally driven motivational values in monkeys. J Neurosci. 2010;30:8591–8601. - PMC - PubMed
    1. Bryden DW, Johnson EE, Diao X, Roesch MR. Impact of expected value on neural activity in rat substantia nigra pars reticulata. Eur J Neurosci. 2011;33:2308–2317. - PMC - PubMed
    1. Bryden DW, Johnson EE, Tobia SC, Kashtelyan V, Roesch MR. Attention for learning signals in anterior cingulate cortex. J Neurosci. 2011;31:18266–18274. - PMC - PubMed

Publication types