. 2013 Dec 15;208(12):2067-74.
doi: 10.1093/infdis/jit331. Epub 2013 Jul 30.

Noninvasive molecular imaging of tuberculosis-associated inflammation with radioiodinated DPA-713

Affiliations

Noninvasive molecular imaging of tuberculosis-associated inflammation with radioiodinated DPA-713

Catherine A Foss et al. J Infect Dis. .

Abstract

Background: Increased expression of translocator protein (TSPO) is a feature of microglial and macrophage activation. Since activated macrophages are key components of tuberculosis-associated inflammation, we evaluated radioiodinated DPA-713, a synthetic ligand of TSPO, for in vivo imaging of host response.

Methods: Mice were infected with aerosolized Mycobacterium tuberculosis and evaluated using whole-body [(125)I]iodo-DPA-713 single-photon emission computed tomography (SPECT). Ex vivo biodistribution and correlative immunofluorescence studies were also performed.

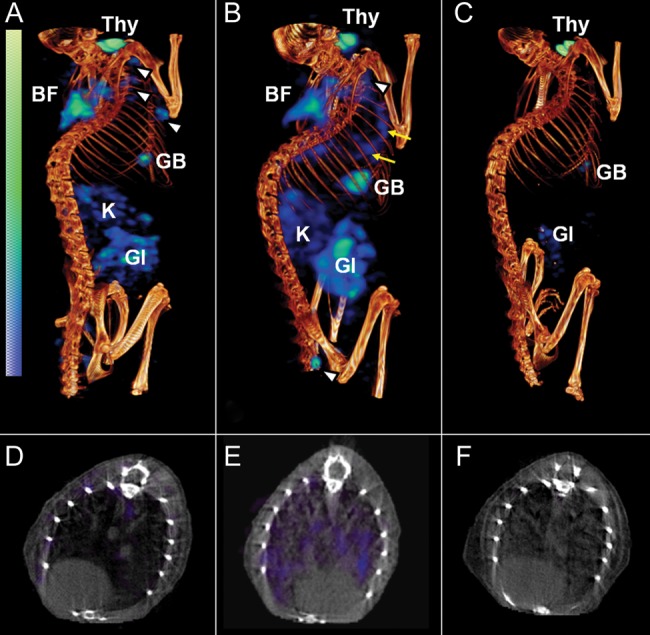
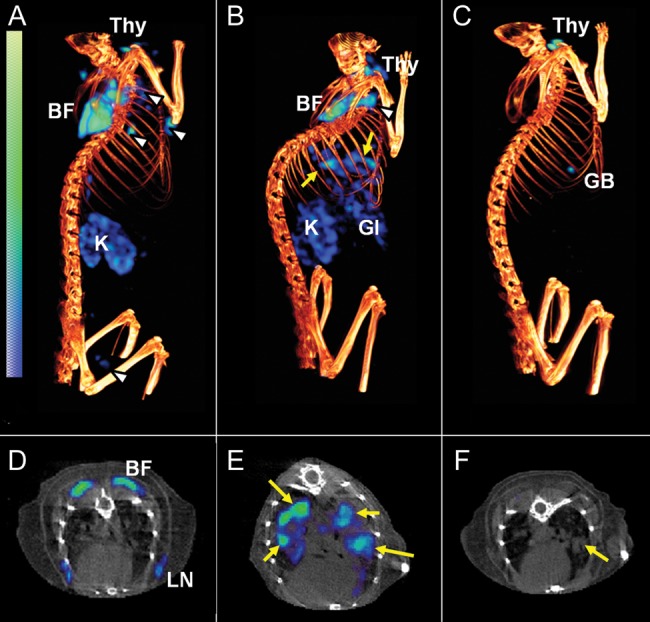
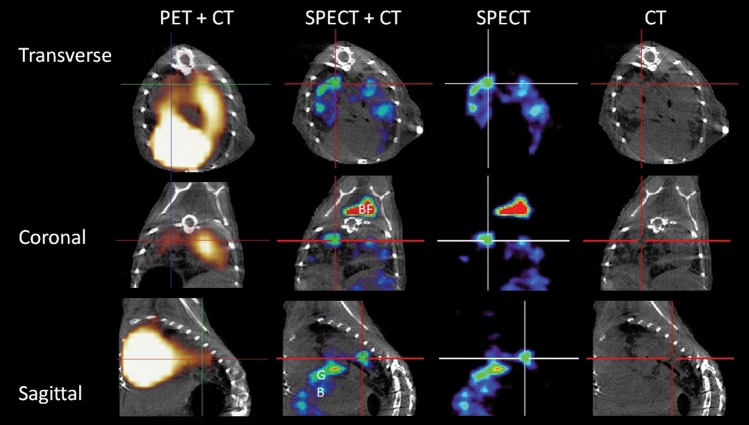
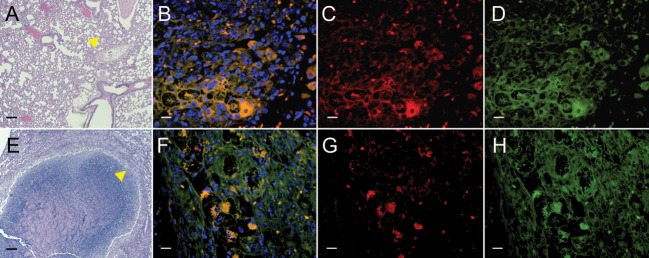
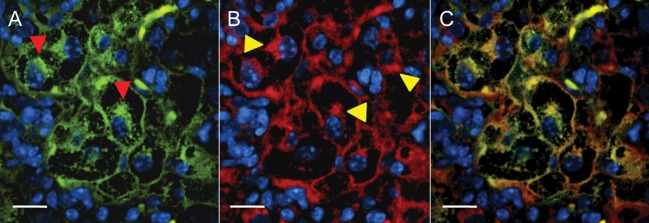
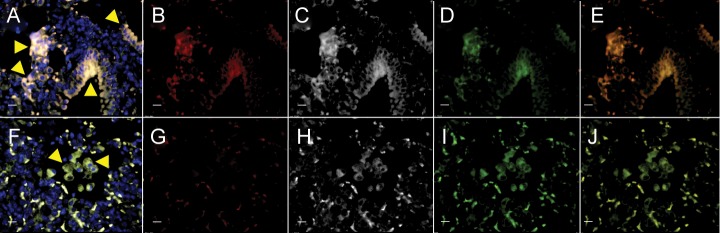
Results: [(125)I]Iodo-DPA-713 SPECT imaging clearly delineated tuberculosis-associated pulmonary inflammation in live animals. Biodistribution studies confirmed radiotracer specificity for inflamed pulmonary tissues. Immunofluorescence studies demonstrated that TSPO is highly expressed in CD68(+) macrophages and phagocytic cells within tuberculosis lesions and that [(125)I]DPA-713 specifically accumulates within these cells. Coadministration of excess unlabelled DPA-713 abrogated both the SPECT and ex vivo fluorescence signals. Lesion-specific signal-to-noise ratios were significantly higher with [(125)I]iodo-DPA-713 SPECT (4.06 ± 0.52) versus [(18)F]fluorodeoxyglucose (FDG) positron emission tomography (PET) (2.00 ± 0.28) performed in the same mice (P = .004).

Conclusions: [(125)I]Iodo-DPA-713 accumulates specifically in tuberculosis-associated inflammatory lesions by selective retention within macrophages and phagocytic cells. [(125)I]Iodo-DPA-713 SPECT provides higher lesion-specific signal-to-noise ratios than [(18)F]FDG PET and may prove to be a more specific biomarker to monitor tuberculosis in situ.

Keywords: PET; macrophage; molecular imaging; pyrazolopyrimidine; translocator protein; tuberculosis.


Figures

Figure 1.
Figure 1.
[125I]Iodo-DPA-713 single-photon emission computed tomography–high-resolution CT (SPECT-CT) of BALB/c mice. Coregistered [125I]iodo-DPA-713 SPECT-CT images from representative Mycobacterium tuberculosis–infected BALB/c mice are shown. Compared with uninfected control mice (A and D), in which only a minimal pulmonary SPECT signal is noted, significant but diffuse signal is observed in the lungs of infected mice (B and E; yellow arrows). Auto-blockade abrogates the SPECT signal from the lungs of infected mice (C and F). Signal is also noted in brown fat (BF), lymph nodes (white arrowheads), gastrointestinal tract (GI), kidneys/adrenal glands (K), gallbladder (GB), and thyroid (Thy).
Figure 2.
Figure 2.
[125I]Iodo-DPA-713 single-photon emission computed tomography–high-resolution CT (SPECT-CT) of C3HeB/FeJ mice. Coregistered [125I]iodo-DPA-713 SPECT-CT images from representative Mycobacterium tuberculosis–infected C3HeB/FeJ mice are shown. Compared with uninfected control mice (A and D), in which only minimal pulmonary SPECT signal is noted, discrete areas of signal, colocalizing with the tuberculosis lesions seen on CT, are observed in the infected mouse (B and E; yellow arrows). Auto-blockade abrogates the SPECT signal from the lungs of infected-mice (C). While the tuberculosis lesion is clearly seen on the CT image (F; yellow arrow), no corresponding SPECT signal is noted because of the auto-blockade. Signal is also noted in brown fat (BF), lymph nodes (white arrowheads), gallbladder (GB), thyroid (Thy), lymph node (LN), gastrointestinal tract (GI), and kidneys/adrenal glands (K).
Figure 3.
Figure 3.
[125I]Iodo-DPA-713 localizes to tuberculosis lesions. The transverse, coronal, and sagittal images from a representative Mycobacterium tuberculosis–infected C3HeB/FeJ mouse that underwent both [125I]iodo-DPA-713 single-photon emission computed tomography–high-resolution CT (SPECT-CT) and [18F]FDG positron emission tomography (PET)–high-resolution CT are shown. Discrete areas of [125I]iodo-DPA-713 SPECT signal are noted in the lungs of the infected mouse. The SPECT signal colocalizes with the tuberculosis lesion seen on CT (crosshair). The [18F]FDG PET signal is more diffuse, with intense signal noted in the heart, obscuring the pericardiac regions. [125I]iodo-DPA-713 SPECT signal is also noted in the brown fat (BF) in the coronal view.
Figure 4.
Figure 4.
Translocator protein (TSPO) expression in tuberculosis lesions. Lung sections from Mycobacterium tuberculosis–infected BALB/c mice or C3HeB/FeJ mice show pneumonic tissues (BALB/c; A [arrow]) or the cellular margins of a necrotic tuberculosis granuloma (C3HeB/FeJ; E [arrow]). This region has dense infiltration by inflammatory cells, such as lymphocytes and activated macrophages. Higher-power views (A and E; yellow arrows) demonstrate immunostaining for TSPO (C and G; red), CD68 (D and H; green), and overlay of TSPO and CD68 with nuclear stain (B and F) are also shown. Note that there are many CD68+ cells in this region, with high TSPO expression that colocalizes with the CD68 signal (yellow; B and F). Scale bars represent 100 μm (for A and E) or 25 μm (for all other panels).
Figure 5.
Figure 5.
Subcellular translocator protein (TSPO) expression in macrophages within tuberculosis lesions. A magnified view of a cluster of macrophages from the cellular margin of a tuberculosis granuloma show the CD68 signal (A; red arrowheads) from the macrophages. B, Corresponding TSPO expression with perinuclear and plasma membrane localization (yellow arrowheads). C, (overlay of A and B) demonstrates that the TSPO expression colocalizes substantially with the CD68 signal within the cells. Scale bars represent 25 μm.
Figure 6.
Figure 6.
DPA-713 accumulates within macrophages. Lungs from infected C3HeB/FeJ mice (AE) and infected but translocator protein (TSPO)–auto-blockaded mice (FJ) were harvested and processed 24 hours following intravenous administration of DPA-713-IRDye680LT (fluorescent analog of DPA-713). Signal from DPA-713-IRDye680LT (B and G; red), TSPO (C and H; white), CD68 (D and I; green), overlay of CD68 with DPA-713-IRDye680LT (E and J), and overlay of all channels with nuclear stain (A and F) are shown. DPA-713-IRDye680LT signal is clearly noted in lung tissues obtained from the infected mouse (B; red) and colocalizes with CD68 (E; yellow). However, while both TSPO (H) and CD68 (I) signals are visible in the lung tissues from the infected but TSPO–auto-blockaded mouse, no DPA-713-IRDye680LT signal is noted (G). Arrows point to a cluster of macrophages or CD68+ phagocytic cells. Scale bars represent 25 μm.

References

    1. Higgins LJ, Pomper MG. The evolution of imaging in cancer: current state and future challenges. Semin Oncol. 2011;38:3–15. - PMC - PubMed
    1. Boehme CC, Nabeta P, Hillemann D, et al. Rapid molecular detection of tuberculosis and rifampin resistance. N Engl J Med. 2010;363:1005–15. - PMC - PubMed
    1. Zelmer A, Carroll P, Andreu N, et al. A new in vivo model to test anti-tuberculosis drugs using fluorescence imaging. J Antimicrob Chemother. 2012;67:1948–60. - PMC - PubMed
    1. Andreu N, Zelmer A, Wiles S. Noninvasive biophotonic imaging for studies of infectious disease. FEMS Microbiol Rev. 2011;35:360–94. - PMC - PubMed
    1. Kong Y, Yao H, Ren H, et al. Imaging tuberculosis with endogenous beta-lactamase reporter enzyme fluorescence in live mice. Proc Natl Acad Sci U S A. 2010;107:12239–44. - PMC - PubMed

Publication types

MeSH terms

Substances