

Reexpression of pyruvate kinase M2 in type 1 myofibers correlates with altered glucose metabolism in myotonic dystrophy
- PMID: 23901116
- PMCID: PMC3746907
- DOI: 10.1073/pnas.1308806110
Reexpression of pyruvate kinase M2 in type 1 myofibers correlates with altered glucose metabolism in myotonic dystrophy
Abstract
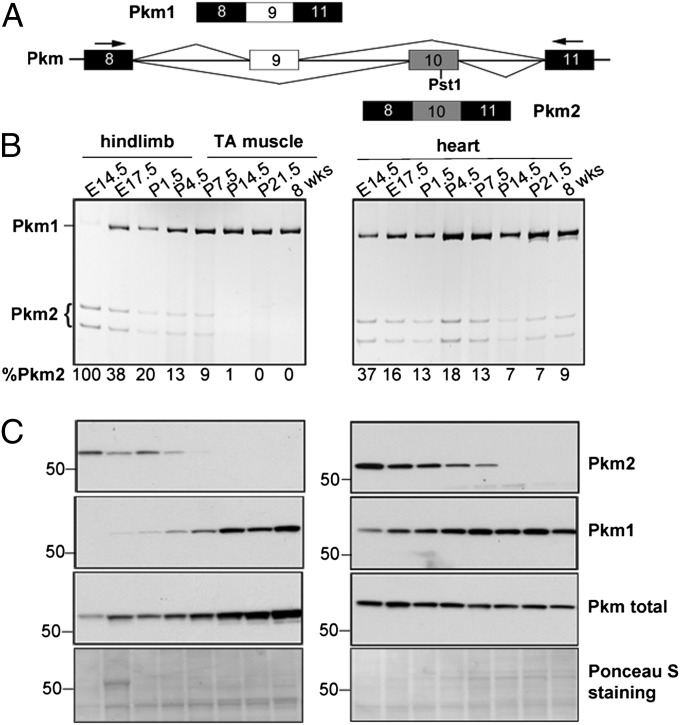
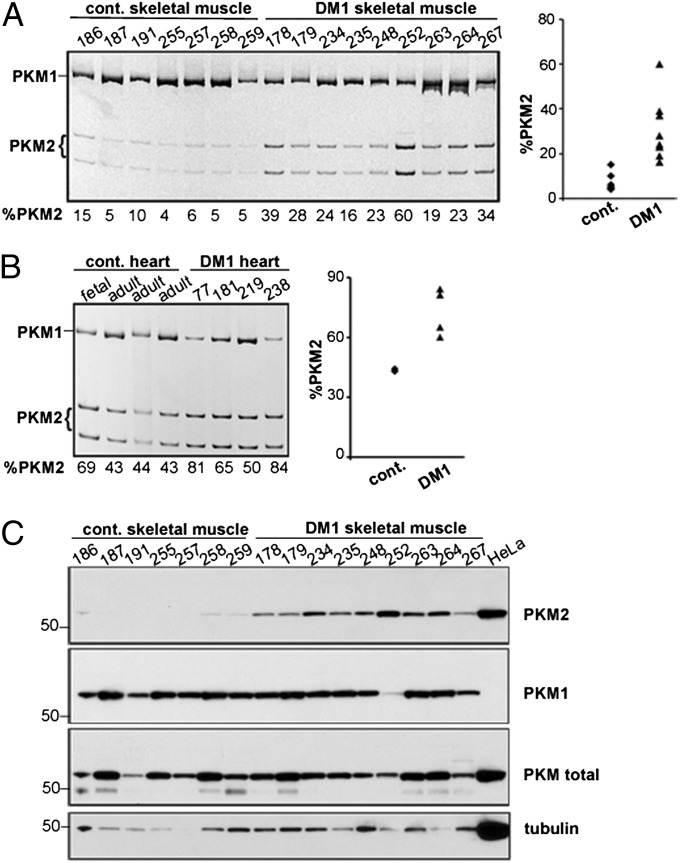
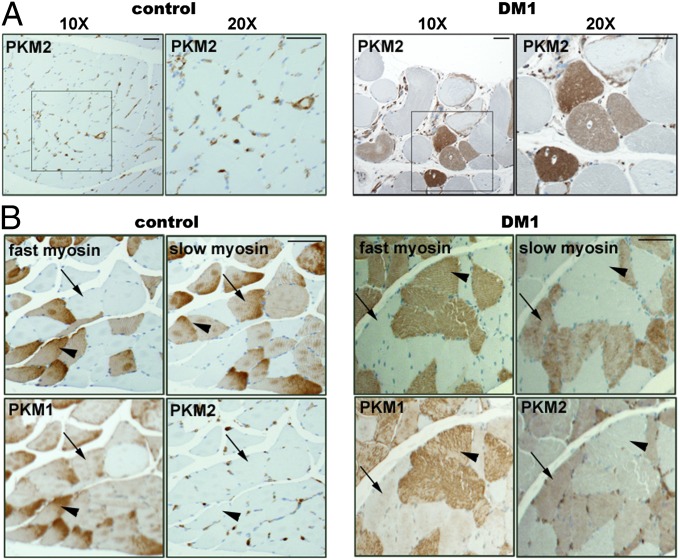
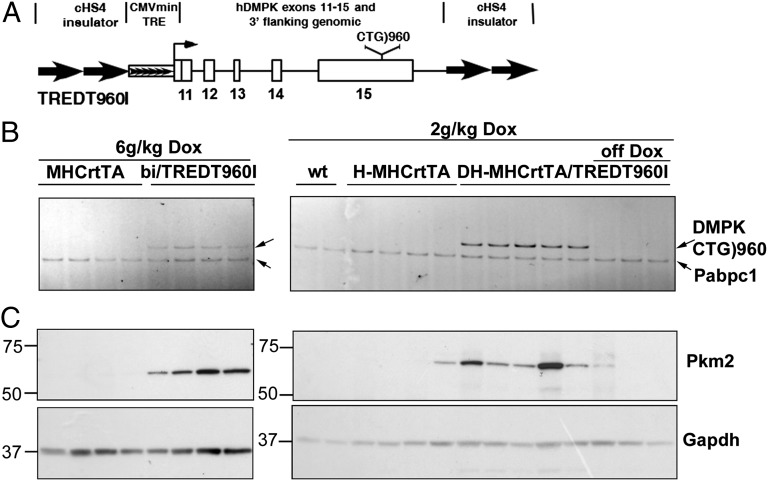
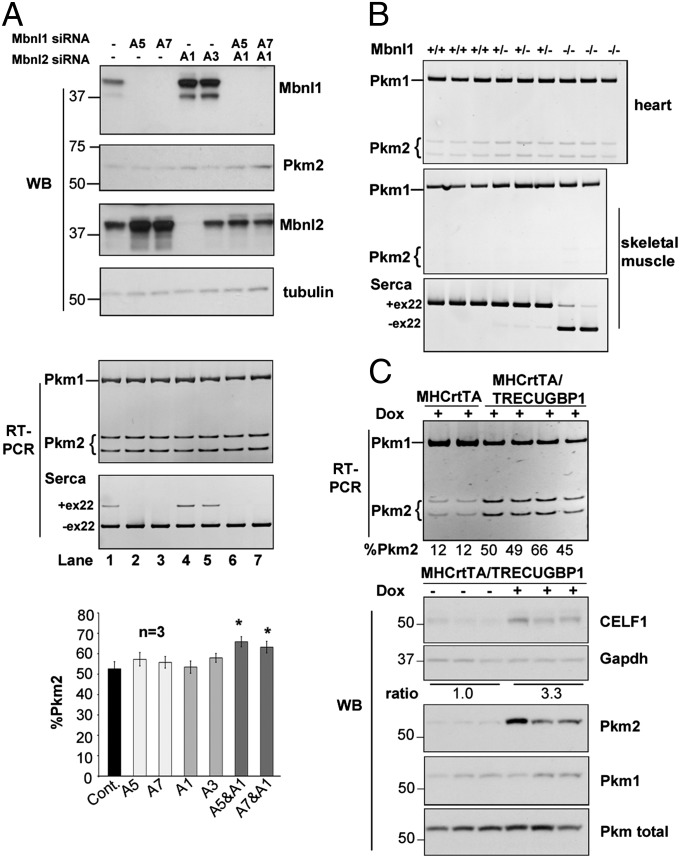
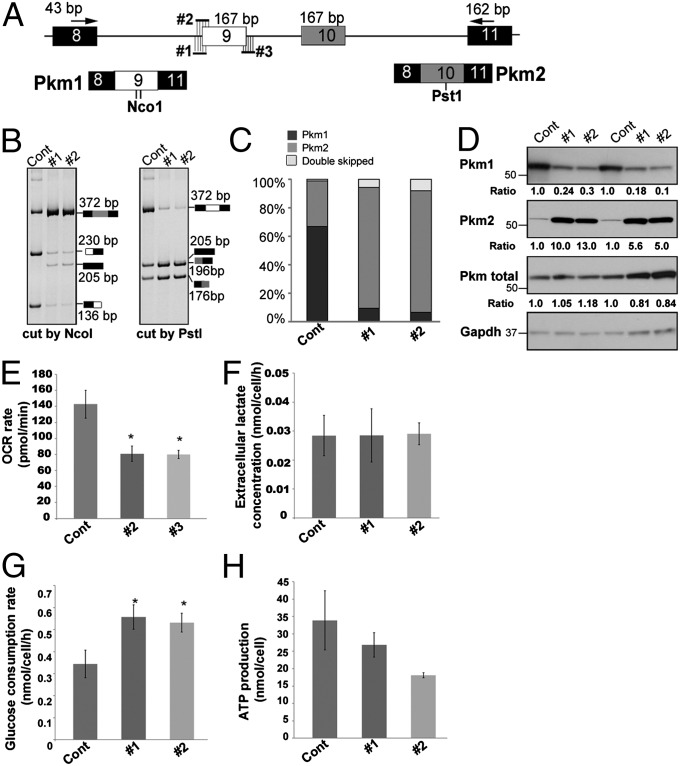
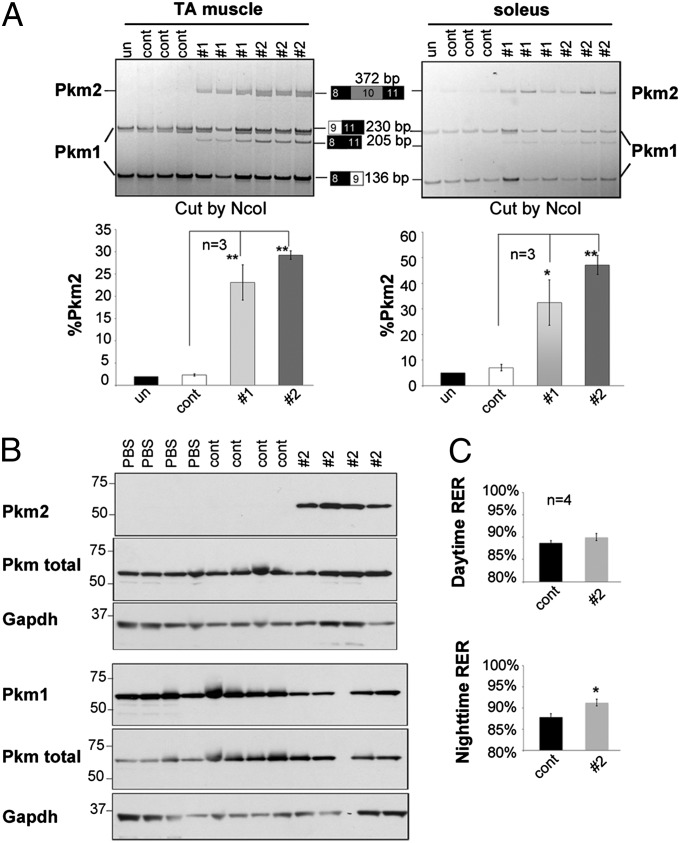
Myotonic dystrophy type 1 (DM1) is caused by expansion of CTG repeats in the 3' UTR of the DMPK gene. Expression of CUG expansion (CUG(exp)) RNA produces a toxic gain of function by disrupting the functions of RNA splicing factors, such as MBNL1 and CELF1, leading to splicing changes associated with clinical abnormalities. Progressive skeletal muscle weakness and wasting is one of the most prominent clinical features in DM1; however, the underlying mechanisms remain unclear. Here we report that the embryonic M2 isoform of pyruvate kinase (PKM2), a key enzyme contributing to the Warburg effect in cancer, is significantly induced in DM1 tissue and mouse models owing to aberrant splicing. Expression of PKM2 in DM1 skeletal muscle is restricted to the type 1 fibers, which are particularly susceptible to wasting in DM1. Using antisense oligonucleotides to shift PKM splicing toward increased PKM2 expression, we observed increased glucose consumption with reduced oxidative metabolism in cell culture and increased respiratory exchange ratio in mice, suggesting defects in energy metabolism conferred by PKM2 expression. We propose that PKM2 expression induces changes in type 1 fibers associated with muscle atrophy and muscle weakness in DM1.
Keywords: alternative splicing; muscular dystrophy; redirected splicing; striated muscle development.
Conflict of interest statement
The authors declare no conflict of interest.
Figures
Similar articles
-
Muscleblind-like 1 knockout mice reveal novel splicing defects in the myotonic dystrophy brain.PLoS One. 2012;7(3):e33218. doi: 10.1371/journal.pone.0033218. Epub 2012 Mar 13. PLoS One. 2012. PMID: 22427994 Free PMC article.
-
Aberrantly spliced alpha-dystrobrevin alters alpha-syntrophin binding in myotonic dystrophy type 1.Neurology. 2008 Feb 26;70(9):677-85. doi: 10.1212/01.wnl.0000302174.08951.cf. Neurology. 2008. PMID: 18299519
-
Alternative splicing dysregulation secondary to skeletal muscle regeneration.Ann Neurol. 2011 Apr;69(4):681-90. doi: 10.1002/ana.22278. Epub 2011 Mar 11. Ann Neurol. 2011. PMID: 21400563 Free PMC article.
-
The hallmarks of myotonic dystrophy type 1 muscle dysfunction.Biol Rev Camb Philos Soc. 2021 Apr;96(2):716-730. doi: 10.1111/brv.12674. Epub 2020 Dec 2. Biol Rev Camb Philos Soc. 2021. PMID: 33269537 Review.
-
Small Molecules Which Improve Pathogenesis of Myotonic Dystrophy Type 1.Front Neurol. 2018 May 18;9:349. doi: 10.3389/fneur.2018.00349. eCollection 2018. Front Neurol. 2018. PMID: 29867749 Free PMC article. Review.
Cited by
-
Burn-induced muscle metabolic derangements and mitochondrial dysfunction are associated with activation of HIF-1α and mTORC1: Role of protein farnesylation.Sci Rep. 2017 Jul 26;7(1):6618. doi: 10.1038/s41598-017-07011-3. Sci Rep. 2017. PMID: 28747716 Free PMC article.
-
LncRNA-encoded peptides in cancer.J Hematol Oncol. 2024 Aug 12;17(1):66. doi: 10.1186/s13045-024-01591-0. J Hematol Oncol. 2024. PMID: 39135098 Free PMC article. Review.
-
Expanded CCUG repeat RNA expression in Drosophila heart and muscle trigger Myotonic Dystrophy type 1-like phenotypes and activate autophagocytosis genes.Sci Rep. 2017 Jun 6;7(1):2843. doi: 10.1038/s41598-017-02829-3. Sci Rep. 2017. PMID: 28588248 Free PMC article.
-
PRMT1 Deficiency in Mouse Juvenile Heart Induces Dilated Cardiomyopathy and Reveals Cryptic Alternative Splicing Products.iScience. 2018 Oct 26;8:200-213. doi: 10.1016/j.isci.2018.09.023. Epub 2018 Oct 2. iScience. 2018. PMID: 30321814 Free PMC article.
-
Autoregulation of MBNL1 function by exon 1 exclusion from MBNL1 transcript.Nucleic Acids Res. 2017 Feb 28;45(4):1760-1775. doi: 10.1093/nar/gkw1158. Nucleic Acids Res. 2017. PMID: 27903900 Free PMC article.
References
-
- Harper PS. Myotonic Dystrophy. London: Saunders; 2001.
-
- Udd B, Krahe R. The myotonic dystrophies: Molecular, clinical, and therapeutic challenges. Lancet Neurol. 2012;11(10):891–905. - PubMed
-
- Brook JD, et al. Molecular basis of myotonic dystrophy: Expansion of a trinucleotide (CTG) repeat at the 3′ end of a transcript encoding a protein kinase family member. Cell. 1992;68(4):799–808. - PubMed
-
- Mahadevan M, et al. Myotonic dystrophy mutation: An unstable CTG repeat in the 3′ untranslated region of the gene. Science. 1992;255(5049):1253–1255. - PubMed
-
- Liquori CL, et al. Myotonic dystrophy type 2 caused by a CCTG expansion in intron 1 of ZNF9. Science. 2001;293(5531):864–867. - PubMed
Publication types
MeSH terms
Substances
Grants and funding
LinkOut - more resources
Full Text Sources
Other Literature Sources
Molecular Biology Databases
Miscellaneous
