. 2014 Jan;270(1):223-31.
doi: 10.1148/radiol.13122578. Epub 2013 Oct 28.

Pediatric CT: implementation of ASIR for substantial radiation dose reduction while maintaining pre-ASIR image noise

Affiliations

Pediatric CT: implementation of ASIR for substantial radiation dose reduction while maintaining pre-ASIR image noise

Samuel L Brady et al. Radiology. 2014 Jan.

Abstract

Purpose: To determine a comprehensive method for the implementation of adaptive statistical iterative reconstruction (ASIR) for maximal radiation dose reduction in pediatric computed tomography (CT) without changing the magnitude of noise in the reconstructed image or the contrast-to-noise ratio (CNR) in the patient.

Materials and methods: The institutional review board waived the need to obtain informed consent for this HIPAA-compliant quality analysis. Chest and abdominopelvic CT images obtained before ASIR implementation (183 patient examinations; mean patient age, 8.8 years ± 6.2 [standard deviation]; range, 1 month to 27 years) were analyzed for image noise and CNR. These measurements were used in conjunction with noise models derived from anthropomorphic phantoms to establish new beam current-modulated CT parameters to implement 40% ASIR at 120 and 100 kVp without changing noise texture or magnitude. Image noise was assessed in images obtained after ASIR implementation (492 patient examinations; mean patient age, 7.6 years ± 5.4; range, 2 months to 28 years) the same way it was assessed in the pre-ASIR analysis. Dose reduction was determined by comparing size-specific dose estimates in the pre- and post-ASIR patient cohorts. Data were analyzed with paired t tests.

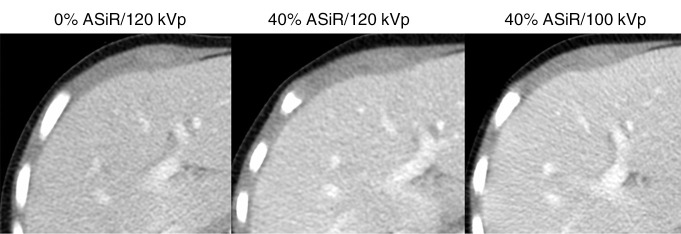
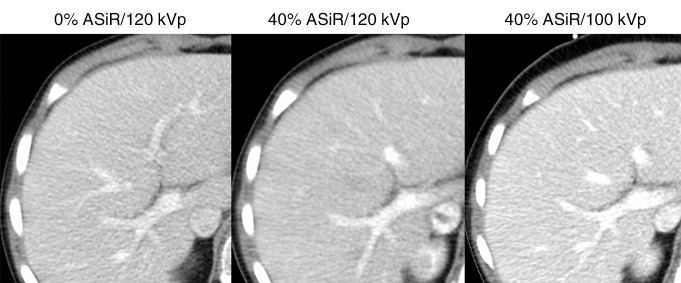
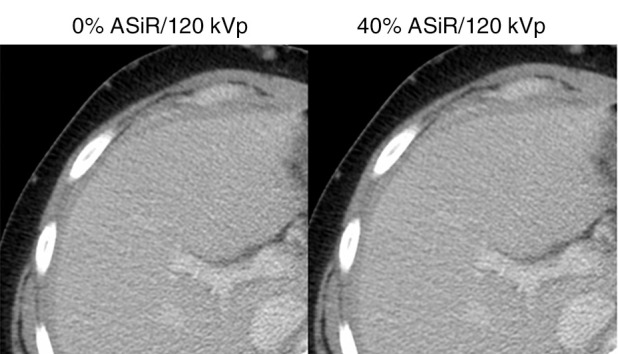
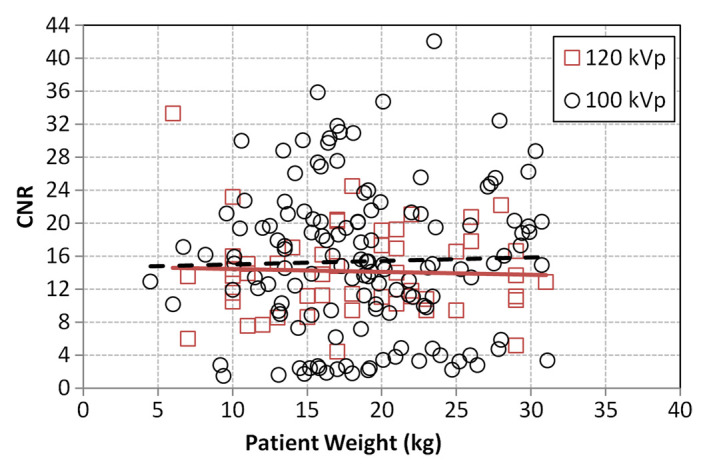
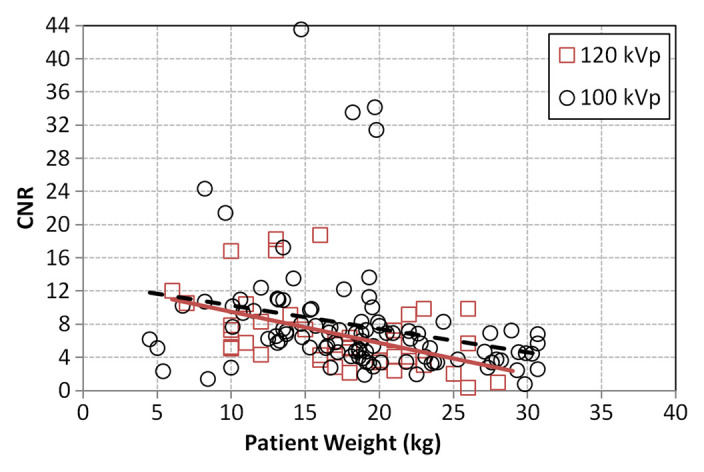
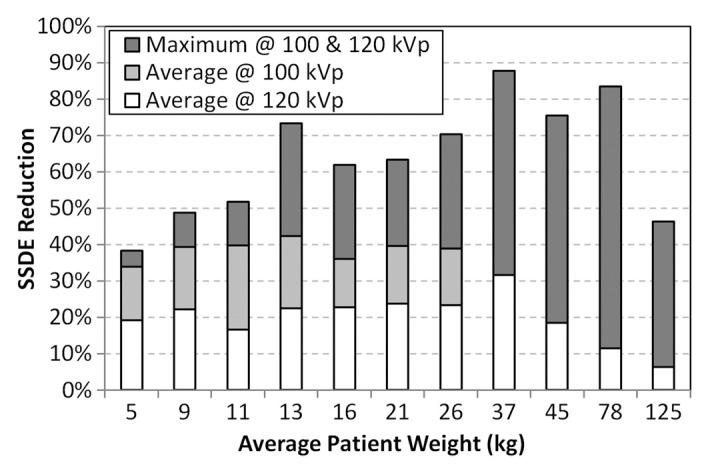
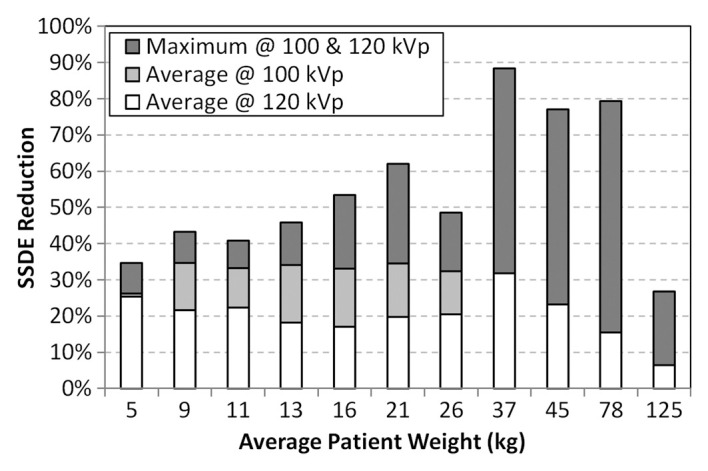
Results: With 40% ASIR implementation, the average relative dose reduction for chest CT was 39% (2.7/4.4 mGy), with a maximum reduction of 72% (5.3/18.8 mGy). The average relative dose reduction for abdominopelvic CT was 29% (4.8/6.8 mGy), with a maximum reduction of 64% (7.6/20.9 mGy). Beam current modulation was unnecessary for patients weighing 40 kg or less. The difference between 0% and 40% ASIR noise magnitude was less than 1 HU, with statistically nonsignificant increases in patient CNR at 100 kVp of 8% (15.3/14.2; P = .41) for chest CT and 13% (7.8/6.8; P = .40) for abdominopelvic CT.

Conclusion: Radiation dose reduction at pediatric CT was achieved when 40% ASIR was implemented as a dose reduction tool only; no net change to the magnitude of noise in the reconstructed image or the patient CNR occurred.


Figures

Figure 1a:
Figure 1a:
Graphs show noise in reconstructed images of anthropomorphic phantoms (1-, 5-, 10-, and 15-year-old size variations) as measured for (a) the chest and (b) the abdomen and pelvis before ASIR implementation (0% ASIR) and with 40% ASIR blended with FBP reconstruction.
Figure 1b:
Figure 1b:
Graphs show noise in reconstructed images of anthropomorphic phantoms (1-, 5-, 10-, and 15-year-old size variations) as measured for (a) the chest and (b) the abdomen and pelvis before ASIR implementation (0% ASIR) and with 40% ASIR blended with FBP reconstruction.
Figure 2a:
Figure 2a:
Graphs show image noise as measured in patient images reconstructed at 0% ASIR and at 40% ASIR for (a) the chest and (b) the abdomen and pelvis. Regression plots for pre-ASIR (dashed line) and post-ASIR (solid line) chest and abdominopelvic examinations are provided for comparison.
Figure 2b:
Figure 2b:
Graphs show image noise as measured in patient images reconstructed at 0% ASIR and at 40% ASIR for (a) the chest and (b) the abdomen and pelvis. Regression plots for pre-ASIR (dashed line) and post-ASIR (solid line) chest and abdominopelvic examinations are provided for comparison.
Figure 3a:
Figure 3a:
Transaxial CT scans in patients show visual image quality at different combinations of ASIR implementation and tube voltage. All images are presented with a window of 350 HU and a level of 40 HU. Each row of images represents images obtained in the same patient imaged at different stages of ASIR and tube voltage reduction implementation. (a) Scans in boy initially imaged on April 27, 2011 (weight, 16 kg; age, 3 years; noise, 13.1 HU; CNR, 13.0), before ASIR implementation, imaged later on May 23, 2012 (weight, 16 kg; age, 4 years; noise, 12.8 HU; CNR, 14.0), after ASIR was implemented, and imaged again on November 15, 2012 (weight, 20 kg; age, 5 years; noise, 13.6 HU; CNR, 14.1), after the implementation of ASIR with tube voltage reduction. (b) Scans in boy imaged on April 19, 2011 (weight, 22 kg; age, 7 years; noise, 13.9 HU; CNR, 12.5), on October 24, 2012 (weight, 22 kg; age, 8 years; noise, 13.8 HU; CNR, 15.5), and on January 14, 2013 (weight, 25 kg; age, 9 years; noise, 15.1 HU; CNR, 15.5). (c) Scans in young woman imaged on May 11, 2011 (weight, 61 kg; age, 21 years; noise, 16.5 HU; CNR, 11.1), and on June 9, 2011 (weight, 61 kg; age, 21 years; noise, 16.2 HU; CNR, 12.2). No images were acquired at 100 kVp for comparison because of her weight classification.
Figure 3b:
Figure 3b:
Transaxial CT scans in patients show visual image quality at different combinations of ASIR implementation and tube voltage. All images are presented with a window of 350 HU and a level of 40 HU. Each row of images represents images obtained in the same patient imaged at different stages of ASIR and tube voltage reduction implementation. (a) Scans in boy initially imaged on April 27, 2011 (weight, 16 kg; age, 3 years; noise, 13.1 HU; CNR, 13.0), before ASIR implementation, imaged later on May 23, 2012 (weight, 16 kg; age, 4 years; noise, 12.8 HU; CNR, 14.0), after ASIR was implemented, and imaged again on November 15, 2012 (weight, 20 kg; age, 5 years; noise, 13.6 HU; CNR, 14.1), after the implementation of ASIR with tube voltage reduction. (b) Scans in boy imaged on April 19, 2011 (weight, 22 kg; age, 7 years; noise, 13.9 HU; CNR, 12.5), on October 24, 2012 (weight, 22 kg; age, 8 years; noise, 13.8 HU; CNR, 15.5), and on January 14, 2013 (weight, 25 kg; age, 9 years; noise, 15.1 HU; CNR, 15.5). (c) Scans in young woman imaged on May 11, 2011 (weight, 61 kg; age, 21 years; noise, 16.5 HU; CNR, 11.1), and on June 9, 2011 (weight, 61 kg; age, 21 years; noise, 16.2 HU; CNR, 12.2). No images were acquired at 100 kVp for comparison because of her weight classification.
Figure 3c:
Figure 3c:
Transaxial CT scans in patients show visual image quality at different combinations of ASIR implementation and tube voltage. All images are presented with a window of 350 HU and a level of 40 HU. Each row of images represents images obtained in the same patient imaged at different stages of ASIR and tube voltage reduction implementation. (a) Scans in boy initially imaged on April 27, 2011 (weight, 16 kg; age, 3 years; noise, 13.1 HU; CNR, 13.0), before ASIR implementation, imaged later on May 23, 2012 (weight, 16 kg; age, 4 years; noise, 12.8 HU; CNR, 14.0), after ASIR was implemented, and imaged again on November 15, 2012 (weight, 20 kg; age, 5 years; noise, 13.6 HU; CNR, 14.1), after the implementation of ASIR with tube voltage reduction. (b) Scans in boy imaged on April 19, 2011 (weight, 22 kg; age, 7 years; noise, 13.9 HU; CNR, 12.5), on October 24, 2012 (weight, 22 kg; age, 8 years; noise, 13.8 HU; CNR, 15.5), and on January 14, 2013 (weight, 25 kg; age, 9 years; noise, 15.1 HU; CNR, 15.5). (c) Scans in young woman imaged on May 11, 2011 (weight, 61 kg; age, 21 years; noise, 16.5 HU; CNR, 11.1), and on June 9, 2011 (weight, 61 kg; age, 21 years; noise, 16.2 HU; CNR, 12.2). No images were acquired at 100 kVp for comparison because of her weight classification.
Figure 4a:
Figure 4a:
Graphs show measured patient CNRs at 40% ASIR implemented at 100 and 120 kVp for (a) the chest and (b) the abdomen and pelvis. Regression plots for 100 kVp (dashed line) and 120 kVp (solid line) are provided for comparison and demonstrate a nonstatistically significant improvement in CNR at 100 kVp for both body regions.
Figure 4b:
Figure 4b:
Graphs show measured patient CNRs at 40% ASIR implemented at 100 and 120 kVp for (a) the chest and (b) the abdomen and pelvis. Regression plots for 100 kVp (dashed line) and 120 kVp (solid line) are provided for comparison and demonstrate a nonstatistically significant improvement in CNR at 100 kVp for both body regions.
Figure 5a:
Figure 5a:
Bar graphs show additive effect of incremental patient dose reduction. First, SSDE reduction was calculated for 40% ASIR implementation for imaging at 120 kVp for both (a) chest and (b) abdominopelvic CT protocols (white bars). Additional dose reduction was then calculated for imaging at 100 kVp (for patients between 0 and 31.5 kg), which provided additional dose savings to the reported 120 kVp reduction levels (ie, total dose savings = white bars + light gray bars). Finally, the maximum dose reduction for imaging at both 100 kVp and that at 120 kVp is shown relative to the mean dose savings (dark gray bars).
Figure 5b:
Figure 5b:
Bar graphs show additive effect of incremental patient dose reduction. First, SSDE reduction was calculated for 40% ASIR implementation for imaging at 120 kVp for both (a) chest and (b) abdominopelvic CT protocols (white bars). Additional dose reduction was then calculated for imaging at 100 kVp (for patients between 0 and 31.5 kg), which provided additional dose savings to the reported 120 kVp reduction levels (ie, total dose savings = white bars + light gray bars). Finally, the maximum dose reduction for imaging at both 100 kVp and that at 120 kVp is shown relative to the mean dose savings (dark gray bars).

References

    1. Kalra MK , Maher MM , Toth TL , et al. Strategies for CT radiation dose optimization . Radiology 2004. ; 230 ( 3 ): 619 – 628 . - PubMed
    1. Brady SL , Yee BS , Kaufman RA . Characterization of adaptive statistical iterative reconstruction algorithm for dose reduction in CT: a pediatric oncology perspective . Med Phys 2012. ; 39 ( 9 ): 5520 – 5531 . - PubMed
    1. Prakash P , Kalra MK , Digumarthy SR , et al. Radiation dose reduction with chest computed tomography using adaptive statistical iterative reconstruction technique: initial experience . J Comput Assist Tomogr 2010. ; 34 ( 1 ): 40 – 45 . - PubMed
    1. Singh S , Kalra MK , Shenoy-Bhangle AS , et al. Radiation dose reduction with hybrid iterative reconstruction for pediatric CT . Radiology 2012. ; 263 ( 2 ): 537 – 546 . - PubMed
    1. Vorona GA , Ceschin RC , Clayton BL , Sutcavage T , Tadros SS , Panigrahy A . Reducing abdominal CT radiation dose with the adaptive statistical iterative reconstruction technique in children: a feasibility study . Pediatr Radiol 2011. ; 41 ( 9 ): 1174 – 1182 . - PubMed