. 2013 Dec;7(12):2315-29.
doi: 10.1038/ismej.2013.129. Epub 2013 Aug 1.

Transcriptional response of bathypelagic marine bacterioplankton to the Deepwater Horizon oil spill

Affiliations

Transcriptional response of bathypelagic marine bacterioplankton to the Deepwater Horizon oil spill

Adam R Rivers et al. ISME J. 2013 Dec.

Abstract

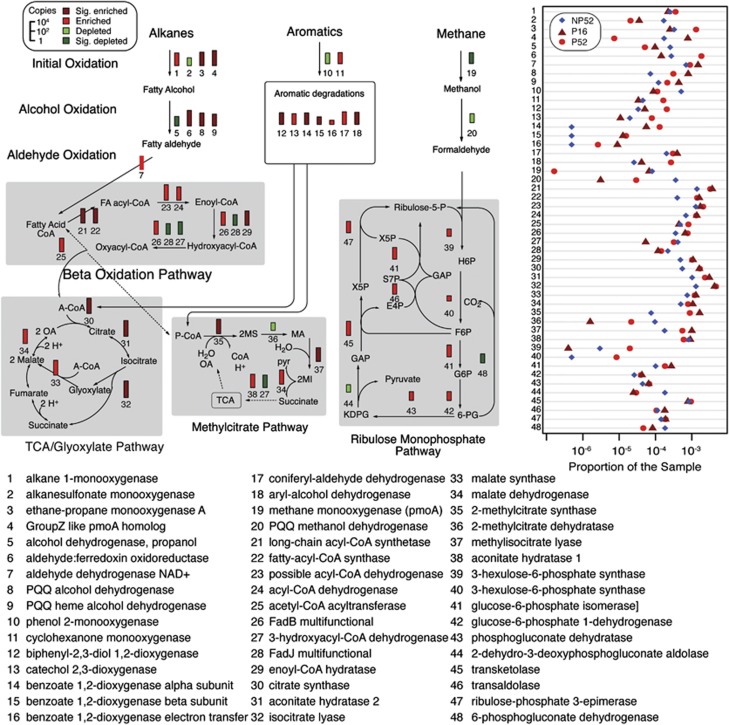
The Deepwater Horizon blowout released a massive amount of oil and gas into the deep ocean between April and July 2010, stimulating microbial blooms of petroleum-degrading bacteria. To understand the metabolic response of marine microorganisms, we sequenced ≈ 66 million community transcripts that revealed the identity of metabolically active microbes and their roles in petroleum consumption. Reads were assigned to reference genes from ≈ 2700 bacterial and archaeal taxa, but most assignments (39%) were to just six genomes representing predominantly methane- and petroleum-degrading Gammaproteobacteria. Specific pathways for the degradation of alkanes, aromatic compounds and methane emerged from the metatranscriptomes, with some transcripts assigned to methane monooxygenases representing highly divergent homologs that may degrade either methane or short alkanes. The microbial community in the plume was less taxonomically and functionally diverse than the unexposed community below the plume; this was due primarily to decreased species evenness resulting from Gammaproteobacteria blooms. Surprisingly, a number of taxa (related to SAR11, Nitrosopumilus and Bacteroides, among others) contributed equal numbers of transcripts per liter in both the unexposed and plume samples, suggesting that some groups were unaffected by the petroleum inputs and blooms of degrader taxa, and may be important for re-establishing the pre-spill microbial community structure.


Figures

Figure 1
Figure 1
The taxonomic composition of the transcript pool based on ∼23 million identified bacterial and archaeal transcripts (a) and the rRNA pool based on ∼350 000 16S rRNA gene sequences (b). Transcript libraries are ordered based on single-linkage clustering of individual. genes, while 16S rRNA libraries are ordered based on single-linkage clustering of the Unifrac metric (Lozupone et al., 2011). Taxa are vertically arranged according to the order shown in the key, and indentations in the key indicate bacterial groups at the class and order level. Sequence libraries were ordinated by nonmetric multidimensional scaling (c and d) using the same distance matrices and environmental variables fit to the 16S rRNA data.
Figure 2
Figure 2
KEGG assignments to pathways related to hydrocarbon metabolism (left) and relative abundance of transcripts mapping to each step (right). The height of the bars in the pathway diagrams represents the number of transcripts (log scale at upper left) summed over samples P16, P52 and NP52, whereas the colors represent enrichment (red) or depletion (green) in the plume samples and darker colors indicate statistically significant differences.
Figure 3
Figure 3
A maximum likelihood tree of pmoA homologs (a) and the proportion of reads originally assigned to the M. capsulatus or M. tundripaludum genome bins that cluster at each node on the tree (b). Five short pmoA reference sequences (in bold text) and 33 257 GOM reads identified as pmoA homologs by Blastx were placed on a reference tree made with full-length sequences. The thickness of the tree branches indicates the number of reads assigned.
Figure 4
Figure 4
The transcripts per liter of seawater for the 50 most abundant bacterial and archaeal taxa in non-plume sample NP52. Taxa were clustered by the ratios of plume to non-plume transcripts, and major groupings are highlighted with shading. Sample P16 is not included because of an internal standard addition error. Transcripts from marine taxa without a close reference genome may be binned to an uninformative species name; for example, marine Actinobacteria sequences bin to Propionibacterium genomes and SAR406 transcripts to the Rhodothermus marinus genome. The dashed lines indicate the limit of detection for each transcriptome.
Figure 5
Figure 5
The expression of genes from three plume-enriched microbes (right half) and three non-responding microbes (left half). The inside track indicates log 2 fold change in abundance, with positive values indicating more transcripts in P16 and P52 after being normalized for the number of reads per sample and organism, and negatives values indicating more transcripts in NP52. Dots on the inside track indicate the genes present on the outside track. The outside track represents the 30 most significant genes that were enriched in the plume samples. Both are color-coded by COG category.

References

    1. Anders S, Huber W. Differential expression analysis for sequence count data. Genome Biol. 2010;11:R106. - PMC - PubMed
    1. Anthony C. The biochemistry of methylotrophs. Academic Press: London, UK; 1982.
    1. Benjamini Y, Hochberg Y. Controlling the false discovery rate - a practical and powerful approach to multiple testing. J R Stat Soc Series B Stat Methodol. 1995;57:289–300.
    1. Boden R, Ferriera S, Johnson J, Kelly DP, Murrell JC, Schäfer H. Draft genome sequence of the chemolithoheterotrophic, halophilic methylotroph Methylophaga thiooxydans DMS010. J Bacteriol. 2011;193:3154–3155. - PMC - PubMed
    1. Camilli R, Reddy CM, Yoerger DR, Van Mooy BAS, Jakuba MV, Kinsey JC, et al. Tracking hydrocarbon plume transport and biodegradation at Deepwater Horizon. Science. 2010;330:201–204. - PubMed

Publication types