Electronic superlattice revealed by resonant scattering from random impurities in Sr3Ru2O7
- PMID: 23903555
- PMCID: PMC3730170
- DOI: 10.1038/srep02299
Electronic superlattice revealed by resonant scattering from random impurities in Sr3Ru2O7
Abstract
Resonant elastic x-ray scattering (REXS) is an exquisite element-sensitive tool for the study of subtle charge, orbital, and spin superlattice orders driven by the valence electrons, which therefore escape detection in conventional x-ray diffraction (XRD). Although the power of REXS has been demonstrated by numerous studies of complex oxides performed in the soft x-ray regime, the cross section and photon wavelength of the material-specific elemental absorption edges ultimately set the limit to the smallest superlattice amplitude and periodicity one can probe. Here we show--with simulations and REXS on Mn-substituted Sr3Ru2O7--that these limitations can be overcome by performing resonant scattering experiments at the absorption edge of a suitably-chosen, dilute impurity. This establishes that--in analogy with impurity-based methods used in electron-spin-resonance, nuclear-magnetic resonance, and Mössbauer spectroscopy--randomly distributed impurities can serve as a non-invasive, but now momentum-dependent probe, greatly extending the applicability of resonant x-ray scattering techniques.
Figures


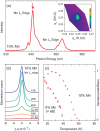
 ) peak across the Ru L2,3 edge at T = 20 K. (b) Temperature dependence of the integrated intensity of the (
 ) peak at the Ru L2 edge; the energy position (2968 eV) of the measurement is shown by the arrow in panel (a).
 ) superlattice diffraction peak measured at 20 K on Sr3(Ru1−xMnx)2O7 with x = 0.1 (the arrow at 641 eV indicates the energy used in the Mn-edge REXS experiments). Inset: full reciprocal space map of the superlattice peak. (b) Temperature dependence of the Mn L3 edge (
 ) momentum scans for x = 0.1. (c) Temperature dependence of the integrated intensity of the (
 ) peak for 5% and 10% Mn-substitution.
 diffraction peaks.
 ) superlattice order, measured at the Mn (red) and Ru (green) L-edges for 10% Mn-substitution.
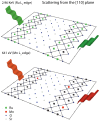
 diffraction peaks for Ru and Mn edges, calculated from the corresponding top panels. (c,d,g,h) Same as (a,b,e,f), now below the long-range antiferromagnetic ordering temperature Torder, with partial magnetic correlations having been established between different antiferromagnetic islands.
References
-
- Hendrickson W. A. Maturation of MAD phasing for the determination of macromolecular structures. J Synchrotron Rad. 6, 845–851 (1999).
-
- Larsson A. M. Preparation and crystallization of selenomethionine protein. IUL Biotechnology Series 8 (Protein Crystallization), 135–154 (2009).
-
- Jánossy A. et al. Antiferromagnetic domains in YBa2Cu3O6+x probed by Gd3+ ESR. Phys. Rev. B 59, 1176–1184 (1999).
-
- Fehér T. et al. Magnetic-field-induced low-energy spin excitations in YBa2Cu4O8 measured by high field Gd3+ electron spin resonance. Phys. Rev. Lett. 85, 5627–5630 (2000). - PubMed
-
- Murakami Y. et al. Direct observation of charge and orbital ordering in La0.5Sr1.5MnO4. Phys. Rev. Lett. 80, 1932 (1998).
Publication types
MeSH terms
Substances
LinkOut - more resources
Full Text Sources
Other Literature Sources

