. 2013 Aug 1;500(7460):54-8.
doi: 10.1038/nature12373.

Nanometre-scale thermometry in a living cell

Affiliations

Nanometre-scale thermometry in a living cell

G Kucsko et al. Nature. .

Abstract

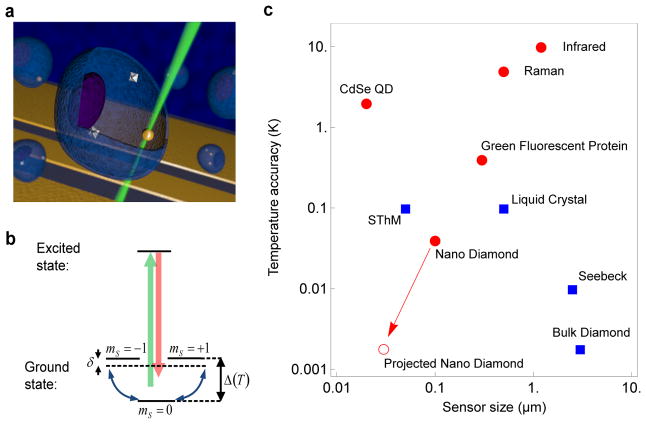
Sensitive probing of temperature variations on nanometre scales is an outstanding challenge in many areas of modern science and technology. In particular, a thermometer capable of subdegree temperature resolution over a large range of temperatures as well as integration within a living system could provide a powerful new tool in many areas of biological, physical and chemical research. Possibilities range from the temperature-induced control of gene expression and tumour metabolism to the cell-selective treatment of disease and the study of heat dissipation in integrated circuits. By combining local light-induced heat sources with sensitive nanoscale thermometry, it may also be possible to engineer biological processes at the subcellular level. Here we demonstrate a new approach to nanoscale thermometry that uses coherent manipulation of the electronic spin associated with nitrogen-vacancy colour centres in diamond. Our technique makes it possible to detect temperature variations as small as 1.8 mK (a sensitivity of 9 mK Hz(-1/2)) in an ultrapure bulk diamond sample. Using nitrogen-vacancy centres in diamond nanocrystals (nanodiamonds), we directly measure the local thermal environment on length scales as short as 200 nanometres. Finally, by introducing both nanodiamonds and gold nanoparticles into a single human embryonic fibroblast, we demonstrate temperature-gradient control and mapping at the subcellular level, enabling unique potential applications in life sciences.


Conflict of interest statement

The authors declare no competing financial interests.

Figures

Figure 1
Figure 1. NV-based nanoscale thermometry
a, Schematic image depicting nanodiamonds and gold nanoparticles (Au NPs) within a living cell. The controlled application of local heat is achieved via laser illumination of the Au NP, while nanoscale thermometry is achieved via precision spectroscopy of the NV spins in nanodiamonds. b, Simplified NV level diagram showing a ground state spin triplet and an excited state. At zero magnetic field, the | ± 1〉 sub-levels are split from the |0〉 state by a temperature-dependent zero field splitting Δ(T). Pulsed microwave radiation is applied (detuning δ) to perform Ramsey-type spectroscopy. c, Comparison between the NV quantum thermometer and other reported techniques as a function of sensor size and temperature accuracy. Red circles indicate methods that are biologically compatible. The red open circle indicates the ultimate expected accuracy for our measurement technique in solution (see Methods).
Figure 2
Figure 2. Sensitivity of single NV Thermometer
a, Measured fluorescence as a function of echo evolution time 2τ (red points); the black solid line indicates a fit corresponding to a damped cosine function with two distinct frequencies. The characteristic beating can be explained by fluctuating proximal charge traps located at distances of about 50 nm. The inset depicts the microwave 2π-echo-pulse sequence used to cancel unwanted external magnetic field fluctuations. b, Measured fluorescence (red points), corresponding error bars (one standard deviation) and best fit line as function of temperature for an echo time of 2τ = 250 μs (bottom) and 2τ′= 50 μs (top). The fixed evolution times of 2τ and 2τ ′ are indicated in (a) by red arrows. The temperature is controlled by a Peltier element at the sample mount, while the (local) x-axis temperature is determined via a thermistor located immediately next to the sample. The fluorescence is converted to population by normalizing to two reference measurements where the spin is prepared in ms = 0 (ms =−1).
Figure 3
Figure 3. Sub-micron thermometry using nanodiamonds
a, Frequency scan of a single nanodiamond containing approximately 500 NV centers. The four red points indicate the measurement frequencies used to extract the temperature as detailed in Methods. b, Two-dimensional confocal scan of nanodiamonds (circles) and Au NPs (cross) spin-coated onto a glass coverslip. The color bar represents fluorescence given in counts per second (cps). c, Temperature of a single nanodiamond as a function of laser power for two different laser-focus locations. The red data points depict the dramatic heating of a nanodiamond as a result of laser illumination on a nearby Au NP. The blue data points depict the same measurement with the laser focus displaced by 0.8 μm from the Au NP location; this results in the negligible heating of the nanodiamond as a function of laser power. The inset shows the measured temperature change of a nanodiamond, when the surrounding temperature is controlled by a Peltier element. d, Temperature changes measured (red points) at the six nanodiamond locations in (b) as a function of distance from the illuminated Au NP (cross). The blue curve represents the theoretical temperature profile based upon a steady-state solution of the heat equation. All data in this figure are obtained on a glass coverslip, and all error bars correspond to one standard deviation.
Figure 4
Figure 4. Nanoscale thermometry in cells
a, Confocal scan of a single cell under 532 nm excitation with collection above 638 nm. The cross corresponds to the position of the Au NP used for heating, while circles represent the location of the nanodiamonds (NV1 and NV2) used for thermometry. The dotted line provides a guide to the eye and outlines the cell membrane. Color bars indicate the fluorescence in cps. b, Measured change in temperature at the position of NV1 and NV2 relative to the incident laser power applied to the Au NP. Dashed lines are linear fits to the data. Each point consists of an average of 5 measurements with each individual measurement taking 4 seconds. The error bars (one standard deviation) are set by fluctuations in the laser heating of the Au NP. c, Fluorescence scan of stained cells (live/dead assay) with excitation at 494/528 nm and emission at 515 nm (green - cell alive) and 617 nm (red - cell dead). The bar plot depicts the temperature of a single nanodiamond (circle) with local heat applied at two different locations (cross). d, Confocal fluorescence scans of an individual cell under varying illumination power. Excitation occurs at 532 nm and collection is above 630 nm. Cell death is indicated by the penetration of ethidium homodimer-1 through the cell membrane, staining the nucleus. At low laser powers, the cell remains alive, while cell-death occurs as laser-induced heating is increased.

Comment in

References

    1. Yue Y, Wang X. Nanoscale thermal probing. Nano reviews. 2012;3 - PMC - PubMed
    1. Lucchetta E, Lee J, Fu L, Patel N, Ismagilov R. Dynamics of drosophila embryonic patterning network perturbed in space and time using microfluidics. Nature. 2005;434:1134–1138. - PMC - PubMed
    1. Kumar SV, Wigge PA. H2a. z-containing nucleosomes mediate the thermosensory response in arabidopsis. Cell. 2010;140:136–147. - PubMed
    1. Lauschke VM, Tsiairis CD, François P, Aulehla A. Scaling of embryonic patterning based on phase-gradient encoding. Nature. 2012;493:101–105. - PubMed
    1. Kamei Y, et al. Infrared laser–mediated gene induction in targeted single cells in vivo. Nature methods. 2008;6:79–81. - PubMed

Publication types