. 2013 Oct;14(7):434-440.
doi: 10.1038/gene.2013.37. Epub 2013 Aug 1.

Genetic burden in multiple sclerosis families

Affiliations

Genetic burden in multiple sclerosis families

N Isobe et al. Genes Immun. 2013 Oct.

Abstract

A previous study using cumulative genetic risk estimations in multiple sclerosis (MS) successfully tracked the aggregation of susceptibility variants in multi-case and single-case families. It used a limited description of susceptibility loci available at the time (17 loci). Even though the full roster of MS risk genes remains unavailable, we estimated the genetic burden in MS families and assess its disease predictive power using up to 64 single-nucleotide polymorphism (SNP) markers according to the most recent literature. A total of 708 controls, 3251 MS patients and their relatives, as well as 117 twin pairs were genotyped. We validated the increased aggregation of genetic burden in multi-case compared with single-case families (P=4.14e-03) and confirm that these data offer little opportunity to accurately predict MS, even within sibships (area under receiver operating characteristic (AUROC)=0.59 (0.55, 0.53)). Our results also suggest that the primary progressive and relapsing-type forms of MS share a common genetic architecture (P=0.368; difference being limited to that corresponding to ± 2 typical MS-associated SNPs). We have confirmed the properties of individual genetic risk score in MS. Comparing with previous reference point for MS genetics (17 SNPs), we underlined the corrective consequences of the integration of the new findings from GWAS and meta-analysis.


Figures

Figure 1
Figure 1
MSGB score differentiates multi-case from single-case MS in UCSF families. The distribution of MSGB is presented using box plots. MSGB is computed using components derived from gender, MHC and non-MHC SNPs. Gray dots represent the MSGB of an individual subject. Groups separated by dotted lines (probands, mothers of probands, fathers of probands and unrelated controls) are divided into multi-case and single-case samples. Spouses of patients were considered genetically unrelated controls. Sample sizes are indicated at the bottom of each box plot. P-values in each of the three left panels indicate the significance of Wilcoxon’s tests of the null hypothesis that MSGB of members of multi-case families are greater than those of members of single-case MS families (P-values without affected mothers and fathers: McMo vs ScMo = 6.63e – 02 and McFa vs ScFa = 3.47e – 02). The P-value in the right panel corresponds to the test that the MSGB of fathers of single-case MS patients is greater than unrelated controls (Wilcoxon’s test). Spouses as healthy unrelated individuals are taken as controls. Fa, father; Mc, multi-case; Mo, mother; Sc, single-case.
Figure 2
Figure 2
Characteristics of the new part of MSGB scores compared with the previous MSGB scores with 17SNPs. y axis represents the new and eventually corrective part of MSGB scores calculated by subtracting MSGB17SNPs from MSGB64SNPs. Similar correlation are obtained by plotting MSGB17SNPs vs MSGB64SNPs (data not shown). UCSF samples with available MSGB scores for both MSGB17SNPs and MSGB64SNPs are included. For MS patients, probands of the family data set and cases in the case–control data set are enrolled. Negative correlation between MSGB17SNPs and new part of MSGB (MSGB64SNPs – MSGB17SNPs) were seen for both MS patients and controls but controls had significantly stronger negative correlation than patients.
Figure 3
Figure 3
Comparison of MSGB scores in monozygotic and dizygotic twin pairs. The distribution of MSGB is represented using box plots. The calculated MSGB does not account for gender or the presence of HLA-DRB1*15:01. Black dots represent the MSGB of unaffected twins or controls; red dots represent the MSGB of affected twins. Individual twin pairs are connected with a red line. P-values between adjacent groups or indicated groups (black horizontal line) represent the significance from a Wilcoxon’s test. CDZ, concordant dizygotic; CMZ, concordant monozygotic; DDZ, discordant dizygotic; DMZ, discordant monozygotic.
Figure 4
Figure 4
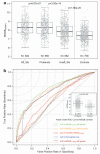
(a) Distribution of MSGB in siblings of MS families. Computations have been done with the 56 SNPs typed in common with all data sets. Distribution of MSGB in siblings of UCSF and French MS multi-case families using box plots. MSGB is computed using components derived from gender, MHC and non-MHC SNPs. Gray dots correspond to the MSGBs of individual subjects. The three left box plots correspond to subjects’ status in sibship (Aff_Sib = affected sibs; Unaff_Sib = unaffected sibs). Sample sizes are indicated at the bottom of each box plot. The first P-value corresponds to the test that MSGBs of affected sibs are different from MSGBs of probands (Wilcoxon’s test). The second P-value corresponds to the test that the MSGBs of multi-case probands is greater than MSGBs of unaffected sibs of probands (Wilcoxon’s test). The P-value overlaying the dotted line indicates the significance of Wilcoxon tests of the null hypothesis that MSGBs of unaffected siblings of probands are greater than the MSGBs of the controls. (b) ROC curves for MS prediction comparing achievement of various MSGBs sib-proband contrasts in sibships compared with the direct use of MSGB scores as predictors in general population. Computations have been done with up to 56 SNPs typed in common with all data sets. ROCs corresponding to: the prediction of MS status of the sibs of the probands from UCSF and French multi-case families based on the contrast between sib’s and proband’s MSGB (dotted lines); only UCSF multi-case families are used for the brown line; the prediction of MS status of the general population based on the contrast between unrelated UCSF controls and UCSF, French and Cambridge multi-case and single-case families probands (full lines); only UCSF samples are used for the brown line. In green, MSGB contrasts are computed using the gender, MHC and non-MHC SNPs components. In orange, MSGB contrasts are computed using the MHC and non-MHC SNPs components. In red, MSGB contrasts are computed using the only the non-MHC SNPs components. In blue, MSGB contrasts are computed using the gender and the MHC components. In brown, MSGB contrasts are computed using the MSGB values of the previously published study (Gourraud et al.) only for UCSF samples of families and case–control data set. The inset corresponds to the distribution of MSGB in probands from UCSF, French and Cambridge multi-case and single-case families and in unrelated UCSF controls, using box plots. Sample sizes are indicated at the bottom of each box plot. The P-value corresponds to the test that the MSGBs of probands are greater than MSGBs of controls (Wilcoxon’s test). AUC, area under the curve; HLA, human leukocyte antigen.
Figure 5
Figure 5
Absence of different MSGB scores calculated with 56 SNPs between patients with relapsing-type MS vs patients with primary progressive MS. The distribution of MSGB56SNPs scores are shown on y axis. The P-value in probands indicates the significance of Wilcoxon tests of the null hypothesis that MSGB56SNPs of relapsing-type MS (CIS + RR + SP) patients are not different from those of primary progressive (PP + PR) patients. The P-value in the right part of the figure corresponds to the Wilcoxon test for the null hypothesis that the MSGB56SNPs of PP + PR MS patients are not different from those of unrelated controls. CIS, clinically isolated syndrome; PP, primary progressive; PR, progressive relapsing; RR, relapsing remitting; SP, secondary progressive.

References

    1. Oksenberg JR, Baranzini SE, Sawcer S, Hauser SL. The genetics of multiple sclerosis: SNPs to pathways to pathogenesis. Nat Rev Genet. 2008;9:516–526. - PubMed
    1. Bush WS, Sawcer SJ, de Jager PL, Oksenberg JR, McCauley JL, Pericak-Vance MA, et al. Evidence for polygenic susceptibility to multiple sclerosis--the shape of things to come. Am J Hum Genet. 2010;86:621–625. - PMC - PubMed
    1. Gourraud PA, Harbo HF, Hauser SL, Baranzini SE. The genetics of multiple sclerosis: an up-to-date review. Immunol Rev. 2012;248:87–103. - PMC - PubMed
    1. Sawcer S, Hellenthal G, Pirinen M, Spencer CC, Patsopoulos NA, Moutsianas L, et al. Genetic risk and a primary role for cell-mediated immune mechanisms in multiple sclerosis. Nature. 2011;476:214–219. - PMC - PubMed
    1. Burton PR, Clayton DG, Cardon LR, Craddock N, Deloukas P, Duncanson A, et al. Association scan of 14,500 nonsynonymous SNPs in four diseases identifies autoimmunity variants. Nat Genet. 2007;39:1329–1337. - PMC - PubMed

Publication types