. 2013 Sep 1;191(5):2665-79.
doi: 10.4049/jimmunol.1202733. Epub 2013 Jul 31.

Histones activate the NLRP3 inflammasome in Kupffer cells during sterile inflammatory liver injury

Affiliations

Histones activate the NLRP3 inflammasome in Kupffer cells during sterile inflammatory liver injury

Hai Huang et al. J Immunol. .

Abstract

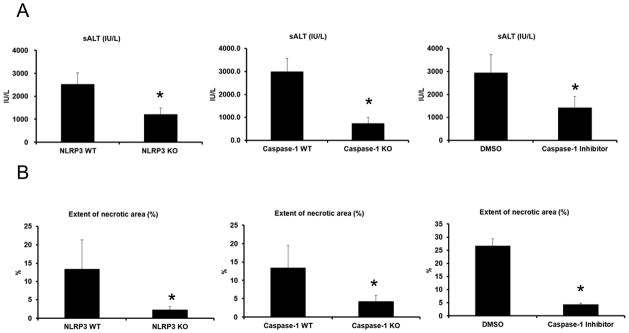
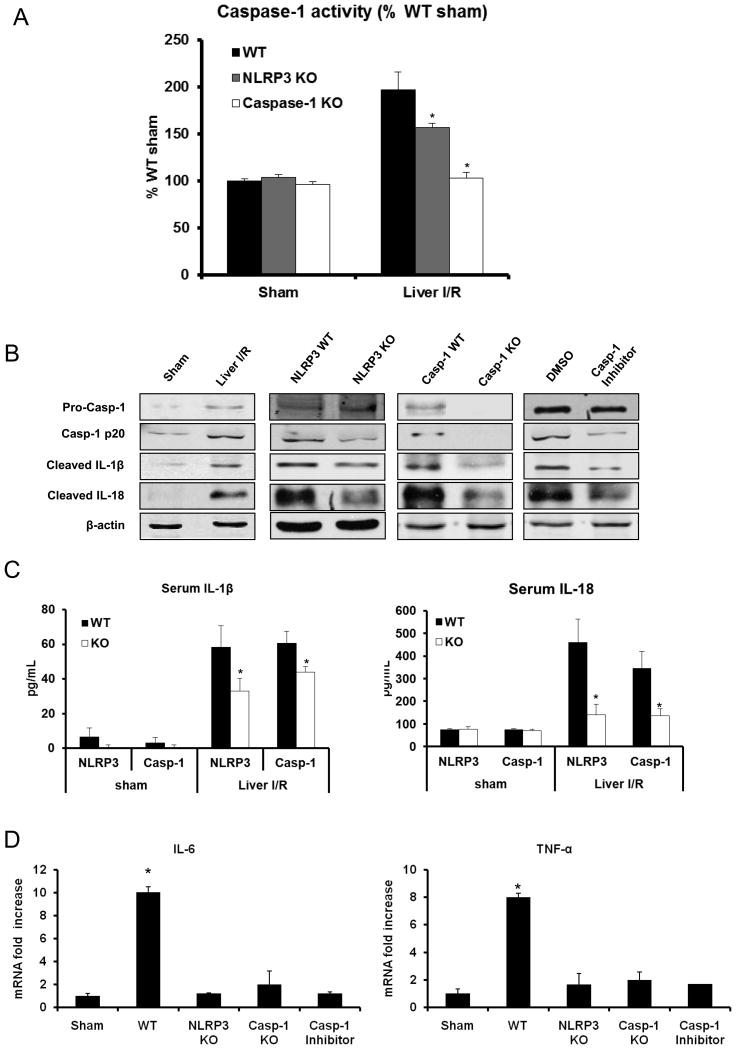
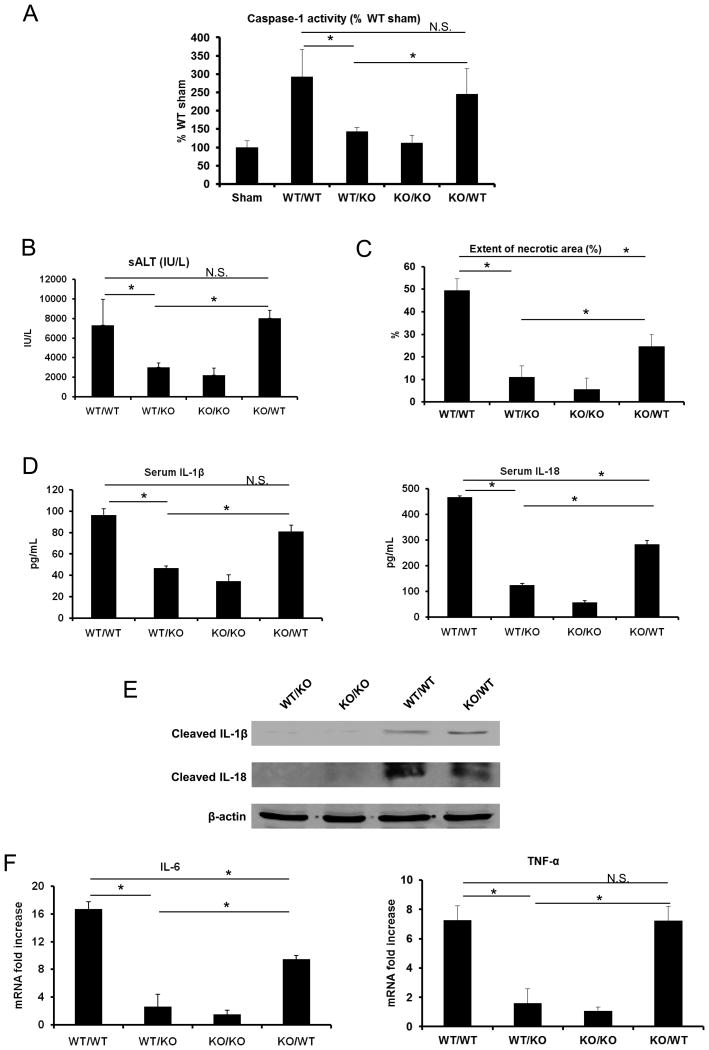
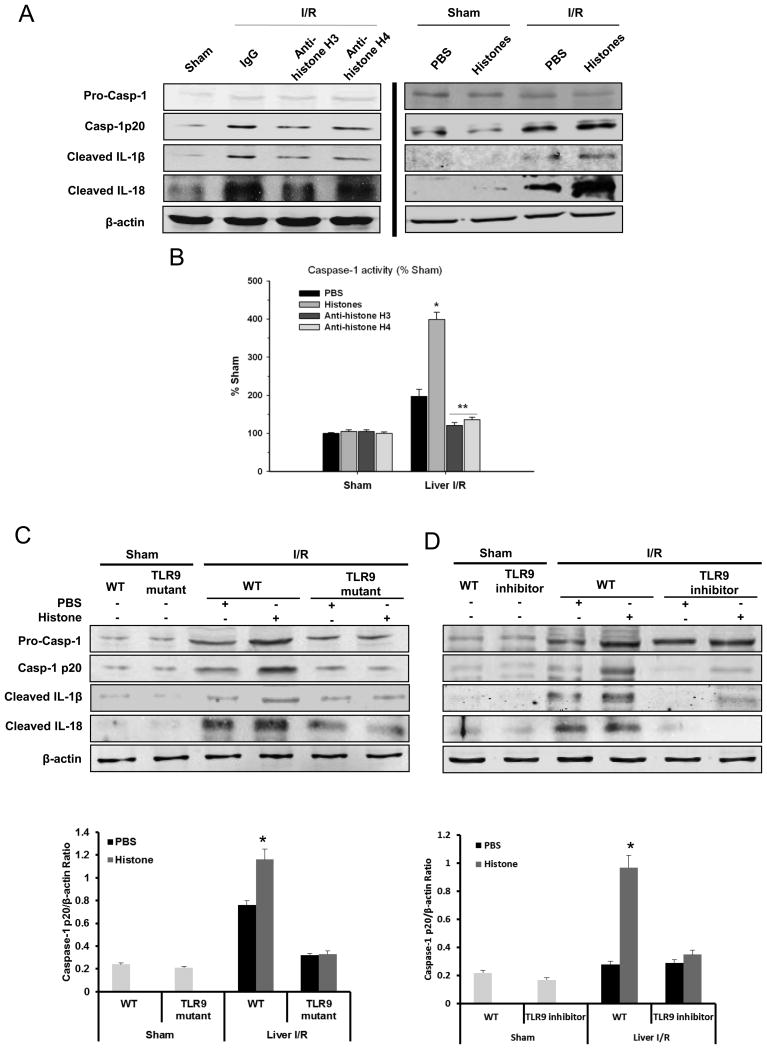
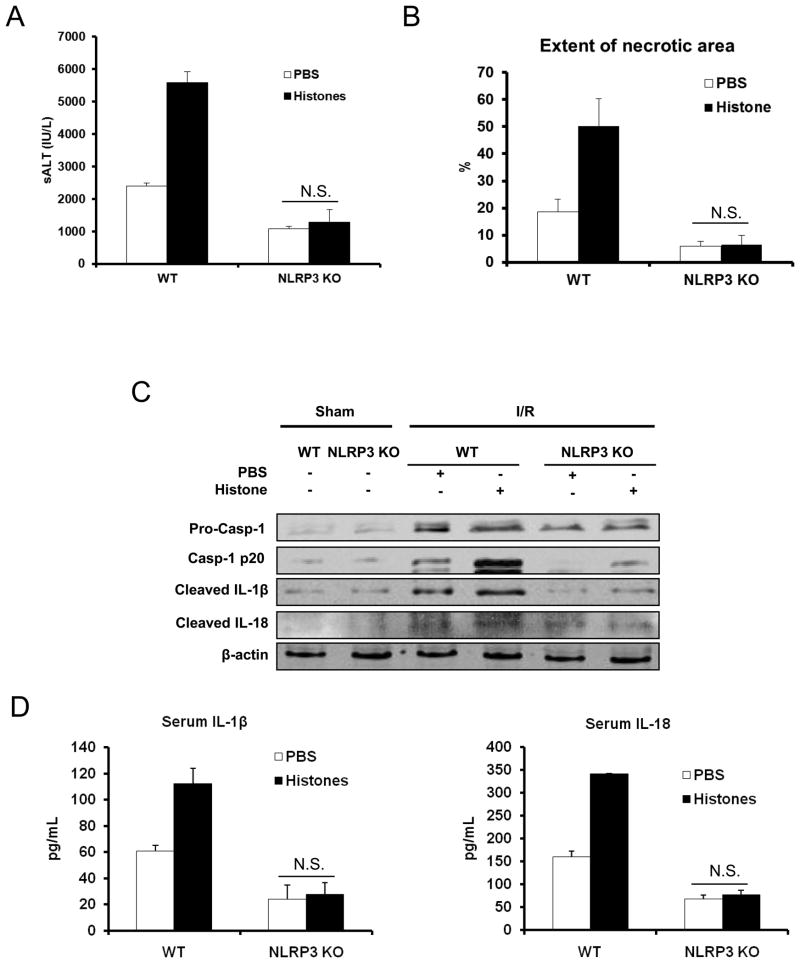
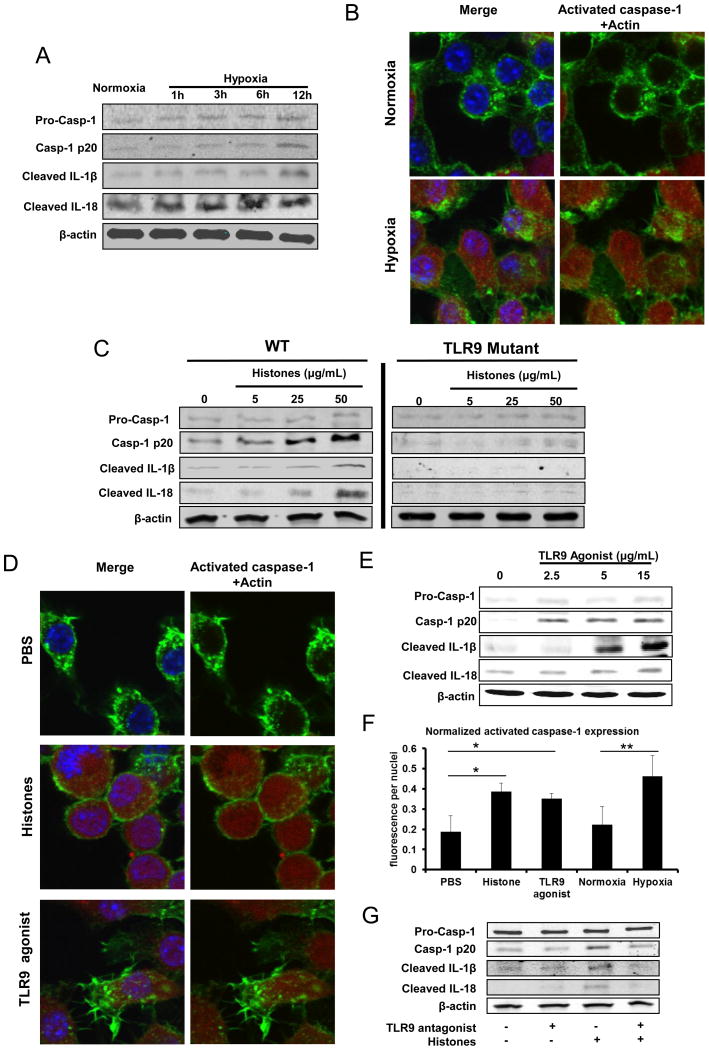
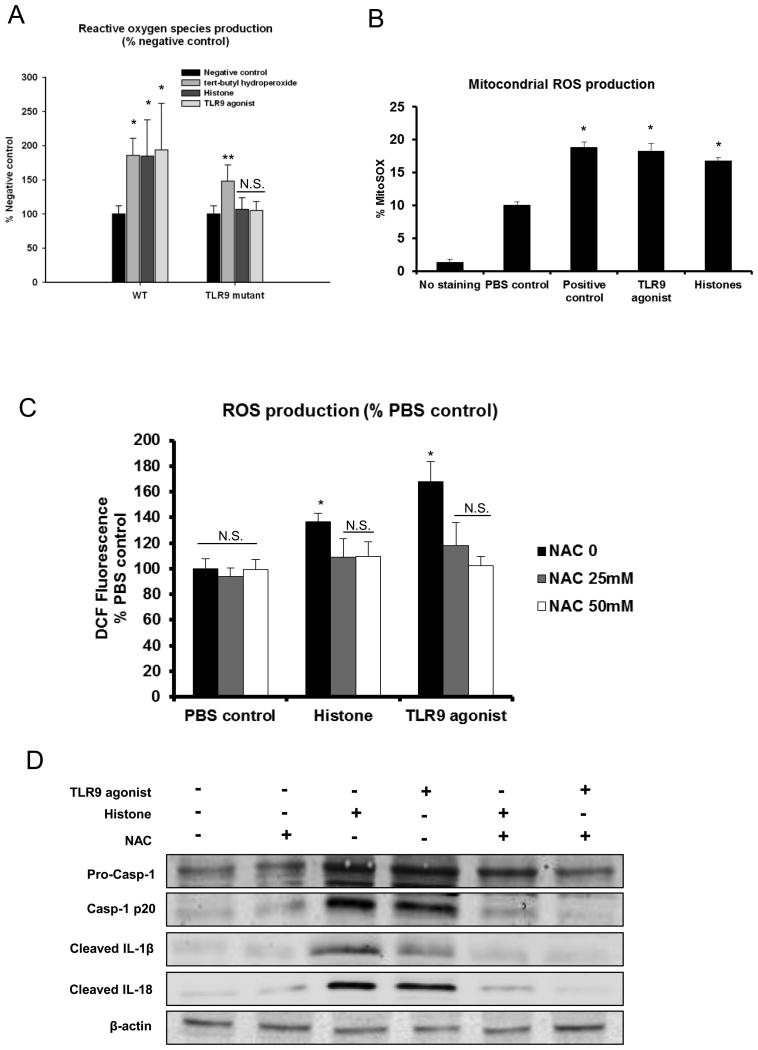
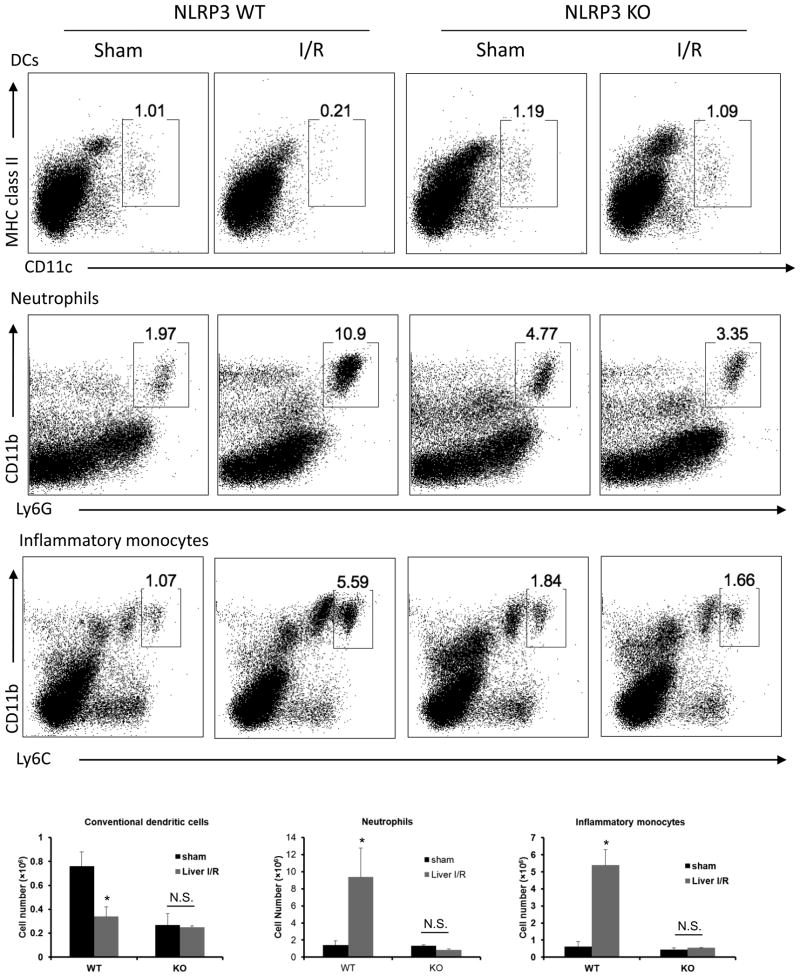
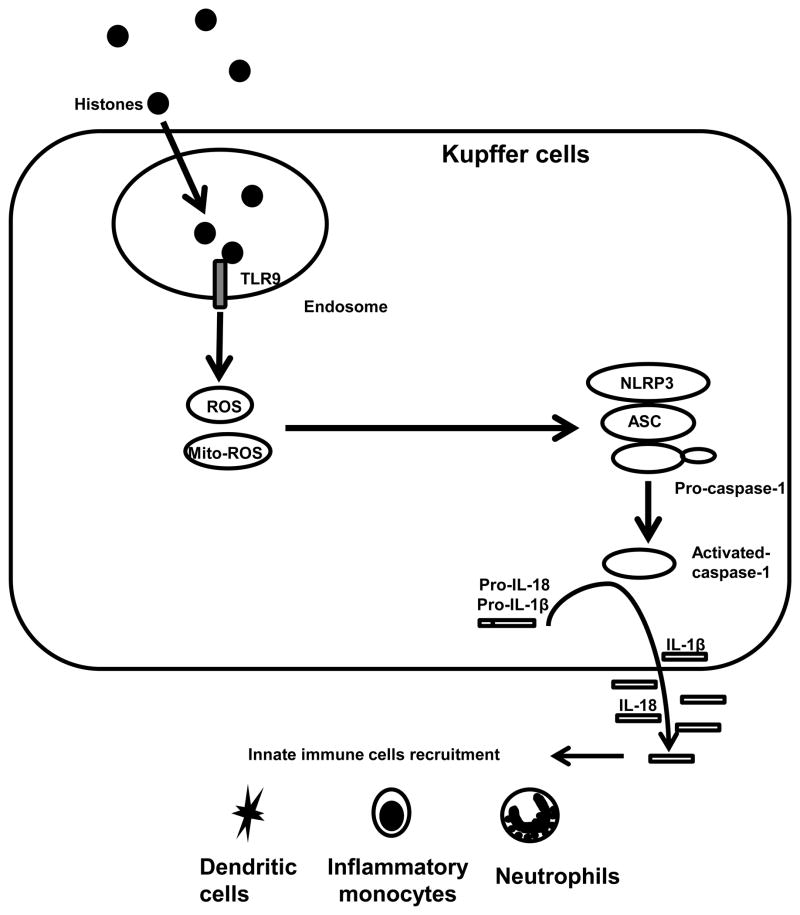
Cellular processes that drive sterile inflammatory injury after hepatic ischemia/reperfusion (I/R) injury are not completely understood. Activation of the inflammasome plays a key role in response to invading intracellular pathogens, but mounting evidence suggests that it also plays a role in inflammation driven by endogenous danger-associate molecular pattern molecules released after ischemic injury. The nucleotide-binding domain, leucine-rich repeat containing protein 3 (NLRP3) inflammasome is one such process, and the mechanism by which its activation results in damage and inflammatory responses following liver I/R is unknown. In this article, we report that both NLRP3 and its downstream target caspase-1 are activated during I/R and are essential for hepatic I/R injury, because both NLRP3 and caspase-1 knockout mice are protected from injury. Furthermore, inflammasome-mediated injury is dependent on caspase-1 expression in liver nonparenchymal cells. Although upstream signals that activate the inflammasome during ischemic injury are not well characterized, we show that endogenous extracellular histones activate the NLRP3 inflammasome during liver I/R through TLR9. This occurs through TLR9-dependent generation of reactive oxygen species. This mechanism is operant in resident liver Kupffer cells, which drive innate immune responses after I/R injury by recruiting additional cell types, including neutrophils and inflammatory monocytes. These novel findings illustrate a new mechanism by which extracellular histones and activation of NLRP3 inflammasome contribute to liver damage and the activation of innate immunity during sterile inflammation.


Figures

Figure 1
Figure 1
Genetic deletion of NLRP3 (NLRP3 KO), caspase-1 (caspase-1 KO) or inhibition of caspase-1 protects against hepatic I/R injury. (A) Serum ALT levels in NLRP3 KO, caspase-1 KO, WT mice treated with caspase-1 inhibitor and their corresponding control animals after liver I/R. WT mice were given caspase-1 inhibitor (Z-YVAD-FMK 100 mg/mouse) or 0.1% DMSO (control) intravenously 30 minutes before ischemia. Data represent the mean ± SE (n = 6 mice per group). Student’s t-test, *P < 0.05 vs. WT control. (B) Quantification of necrotic hepatocytes in hematoxylin and eosin-stained liver sections from NLRP3 KO, caspase-1 KO, caspase-1 inhibitor treated mice and WT animals 6 hours after reperfusion. The graph is representative of liver sections from six mice per group. Student’s t-test, *P < 0.05 vs. WT control. Histological sections were assessed in a blinded manner by two individual examiners, who were unaware of the treatment group assignment of the animals, and quantified using a semi-quantitative scoring system to assess liver damage (17).
Figure 2
Figure 2
Activation of NLRP3 inflammasome is involved in liver I/R. (A) Activation of caspase-1 in NLRP3 KO, caspase-1 KO and WT mice subjected to liver I/R compared to the WT sham group, assessed by colorimetric assay. Data represent the mean ± SE (n = 6 mice per group). ANOVA Tukey test, *P < 0.05, NLRP3 KO group versus WT group after I/R. (B) Western blot images showing the protein levels of activated (cleaved) caspase-1, IL-1β and IL-18 in liver of WT (C57BL/6) mice, NLRP3 KO, caspase-1 KO and caspase-1 inhibitor treated-mice at 6 hours after reperfusion. Each lane represents a separate animal. The blots shown are representatives of three experiments with similar results. (C) Serum levels of IL-1β and IL-18 obtained from NLRP3 KO, caspase-1 KO mice and their WT at 6 hours after reperfusion were measured by ELISA and compared to the sham group. Data represent the mean ± SE (n = 6 mice per group) ANOVA Tukey test, *P<0.05 vs. WT control. (D) IL-6 and TNF-α mRNA levels in NLRP3 KO or caspase-1 KO mice vs WT mice after 6 hours I/R, ANOVA Tukey test, *P < 0.05 WT vs. sham, NALP3 KO, caspase-1 KO or caspase-1 treated mice.
Figure 3
Figure 3
Functional caspase-1 on bone marrow derived cells, not parenchymal cells, is required for liver I/R injury. (A) Activation of caspase-1 in WT/WT, WT/KO, KO/WT and WT/WT mice subjected to liver I/R compared to the WT sham group, assessed by colorimetric assay. Data represent the mean ± SE (n = 6 mice per group). ANOVA Holm-Sidak method, *P < 0.05 WT/KO vs. KO/WT, WT/WT vs. WT/KO; N.S., not significant WT/WT vs. KO/WT. (B) Serum ALT levels in caspase-1 chimeric mice after liver I/R. Data represent the mean ± SE (n = 4–6 mice per group). ANOVA Holm-Sidak method, *P < 0.05 WT/KO vs. KO/WT, WT/WT vs. WT/KO; N.S., not significant WT/WT vs. KO/WT. (C) Quantification of necrotic hepatocytes in hematoxylin and eosin-stained liver sections from caspase-1 chimeric mice 6 hours after reperfusion. The graph is representative of liver sections from 4–6 mice per group ANOVA Holm-Sidak method, *P < 0.05, WT/KO vs. KO/WT, WT/WT vs. WT/KO, WT/WT vs. KO/WT; N.S., not significant. (D) Serum levels of IL-1β and IL-18 obtained from caspase-1 chimeric mice at 6 hours after reperfusion were measured by ELISA. Data represent the mean ± SE (n = 4–6 mice per group). ANOVA Holm-Sidak method, *P < 0.05, WT/KO vs. KO/WT, WT/WT vs. WT/KO, WT/WT vs. KO/WT; N.S., not significant WT/WT vs. KO/WT. (E) Western blot images showing the protein levels of activated (cleaved) IL-1β and IL-18 in liver of caspase-1 chimeric mice at 6 hours after reperfusion. Each lane represents a separate animal. The blots shown are representatives of three experiments with similar results. (F) IL-6 and TNF-α mRNA levels in NLRP3 KO or caspase-1 KO mice vs WT mice after 6 hours I/R, ANOVA Holm-Sidak method, *P < 0.05, WT/KO vs. KO/WT, WT/WT vs. WT/KO, WT/WT vs. KO/WT; N.S., not significant WT/WT vs. KO/WT.
Figure 4
Figure 4
Extracellular histones activate NLRP3 inflammasome during liver I/R. (A) Western blot images showing inflammasome protein level activated caspase-1, IL-1β and IL-18 in liver of WT (C57BL/6) mice at 6 hours after reperfusion. Sham or I/R-treated mice was given either a nonlethal dose of exogenous histone mixture (25 mg/kg body weight), vehicle PBS, anti-histone H3 antibody, anti-histone H4 antibody (20 mg/kg body weight) or control antibody intravenously 30 minutes prior to ischemia. Each lane represents a separate animal. (B) Activation of caspase-1 in WT mice treated with vehicle PBS, exogenous histone mixture, anti-histone H3 or anti-histone H4 antibody that were subjected to liver I/R compared to sham treated-mice, assessed by colorimetric assay. Data represent the mean ± SE (n = 6 mice per group). ANOVA Tukey test, *P < 0.05, PBS vs. Histones; **P < 0.05, anti-histone H3 or H4 vs. PBS. Extracellular histones activate NRLP3 inflammasome through TLR9 signaling pathway during liver I/R. (C) Protein levels of activated caspase-1, IL-1β and IL-18 in liver of TLR9 mutant or WT mice treated with PBS or exogenous histones (25 mg/kg body weight) and quantitative densitometry of the protein expressions of activated caspase-1. (D) Protein levels of activated caspase-1, IL-1β and IL-18 in liver of TLR9 inhibitor treated- or control CpG treated-mice administrated with PBS or exogenous histones and quantitative densitometry of the protein expressions of activated caspase-1. Each lane represents a separate animal and each animal was harvested after 6 hours of reperfusion. The blots shown are representatives of three experiments with similar results Student’s t-test, *P < 0.05, PBS vs. Histones.
Figure 5
Figure 5
Extracellular histones mediated hepatic I/R injury depends on NLRP3 inflammasome. (A) Serum ALT levels in NLRP3 KO or WT mice after 6 hours of reperfusion that were treated with PBS or exogenous histones (25 mg/kg body weight). Data represent the mean ± SE (n = 7 mice per group). Student’s t-test Mann-Whitney Rank Sum Test, N.S., not significant PBS vs. Histones. (B) Quantification of necrotic hepatocytes in hematoxylin and eosin-stained liver sections from histone treated- or PBS treated-NLRP3 KO mice 6 hours after reperfusion. The graph is representative of liver sections from six mice per group. ANOVA Tukey test, N.S., not significant PBS vs. Histones (C) Protein levels of activated caspase-1, IL-1β and IL-18 in liver of TLR9 mutant or WT mice treated with PBS or exogenous histones. Each lane represents a separate animal. The blots shown are representatives of three experiments with similar results. (D) Serum levels of IL-1β and IL-18 obtained from NLRP3 KO mice and WT counterparts at 6 hours after reperfusion that were treated with PBS or exogenous histones (25 mg/kg body weight) were measured by ELISA and compared to the sham group. Data represent the mean ± SE (n = 6 mice per group). NLRP3 KO mice vs WT mice after I/R, Student’s t-test, N.S., not significant PBS vs. Histones.
Figure 6
Figure 6
NLRP3 inflammasome in KCs is activated by extracellular histones through TLR9 pathway. Whole cell lysate from KCs after stimulation was subjected to western blot analysis of activated caspase-1, IL-1β and IL-18. For Western blot images: The blots shown are representatives of three experiments with similar results. (A) Cultured mouse KCs were exposed to hypoxia (1% O2) from 0 to 12 hours. (B) The activated caspase-1 in cultured KCs obtained WT mice stimulated with normoxia or hypoxia (1% O2) overnight was visualized with caspase-1 fluorochrome inhibitor of caspase-1 reagent and observed under confocal microscope. Green, actin; blue, nuclei; red, activated caspase-1. (C) Cultured KCs from WT or TLR9 mutant mice were stimulated with exogenous histones from dosage of 0 to 50 μg/mL for 12 hours. (D) The activated caspase-1 in cultured KCs that were stimulated with exogenous histones (25 μg/mL) or TLR9 agonist (15μg/mL) or PBS for 12 hours, was visualized with caspase-1 fluorochrome inhibitor of caspase-1 reagent and observed under confocal microscope. Green, actin; blue, nuclei; red, activated caspase-1. (E) Cultured mouse KCs were stimulated with TLR9 agonist from dosage of 0 to 15μg/mL for 12 hours. (F) Quantitation of activated caspase-1 in cultured mouse KCs was measured using the analytical software MetaMorph and normalized to nuclei within the sample field. ANOVA Holm-Sidak method, *P < 0.05; Histones or TLR9 agonist vs. PBS treated-KCs, **P < 0.05; Hypoxia vs. Normoxia treated KCs. (G) Cultured mouse KCs were stimulated with TLR9 antagonist or/and exogenous histones for 12 hours.
Figure 7
Figure 7
TLR9 signaling pathway is involved in the activation of NLRP3 inflammasome through the increase of mitochondrial and total cellular ROS production. (A) Cellular ROS production detected by high content analysis in cultured whole NPCs, which were obtained from WT or TLR9 mutant mice, were stimulated with exogenous histones or TLR9 agonist and then compared with negative and positive control stimulation. ANOVA Dunn’s method, *P < 0.05 compared to negative control. **P < 0.05 compared to negative control. N.S., not significant compared to negative control. (B) Flow cytometry of cultured KCs stimulated with exogenous histones, TLR9 agonist or PBS were stained with MitoSOX and were compared with negative and positive controls. The bar graph represents pooled data from three experiments. ANOVA Tukey test, *P < 0.05 compared to PBS treatment. (C) KCs from WT mice stimulated with NAC (0, 25 or 50 mM) Cells were subjected to exogenous histones (50 μg/mL), TLR9 agonist (15 μg/mL) or PBS for 12 hours. ROS production measured by DCF assay shown is the percent increase relative to respective normoxic controls. ANOVA Holm-Sidak method, *, P < 0.05 versus NAC treated KCs. N.S., not significant. (D) KCs from WT mice stimulated with NAC (50mM) were subjected to exogenous histones (50 μg/mL), TLR9 agonist (15 μg/mL) or PBS for 12 hours. Whole cell lysate from KCs after stimulation was subjected to western blot analysis of activated caspase-1, IL-1β and IL-18. For Western blot images: The blots shown are representatives of three experiments with similar results.
Figure 8
Figure 8
NLRP3 inflammasome regulates innate immune cells in liver I/R. Flow cytometry analysis with a quantitative evaluation of NPCs in homogenized ischemia liver lobes in NLRP3 KO and WT mice. Gated percentages of conventional dendritic cells (cDCs), neutrophils, and inflammatory monocytes were evaluated. (B) Absolute numbers (in million of cells) of cDCs, neutrophils, and inflammatory monocytes cells. Data represent the mean ± SE (n = 6 mice per group). ANOVA Tukey test, *P < 0.05 compared to sham mice N.S., not significant sham vs. liver I/R. Each experiment was repeated a minimum of three times.
Figure 9
Figure 9
Hypothetical model illustrating the role of extracellular histones in the activation of NLRP3 inflammasome through TLR9 in liver I/R injury. During liver I/R injury, extracellular histones are sensed by TLR9, which initiates the cellular and mitochondrial ROS production. ROS then activates the NLRP3 inflammasome. Activation of NLRP3 inflammasome further regulates innate immune cells in liver I/R.

Similar articles

Cited by

References

    1. Zhai Y, Busuttil RW, Kupiec-Weglinski JW. Liver ischemia and reperfusion injury: new insights into mechanisms of innate-adaptive immune-mediated tissue inflammation. Am J Transplant. 2011;11:1563–1569. - PMC - PubMed
    1. Vardanian AJ, Busuttil RW, Kupiec-Weglinski JW. Molecular mediators of liver ischemia and reperfusion injury: a brief review. Mol Med. 2008;14:337–345. - PMC - PubMed
    1. Klune JR, Tsung A. Molecular biology of liver ischemia/reperfusion injury: established mechanisms and recent advancements. Surg Clin North Am. 2010;90:665–677. - PubMed
    1. Strowig T, Henao-Mejia J, Elinav E, Flavell R. Inflammasomes in health and disease. Nature. 2012;481:278–286. - PubMed
    1. Davis BK, Wen H, Ting JP. The inflammasome NLRs in immunity, inflammation, and associated diseases. Annu Rev Immunol. 2011;29:707–735. - PMC - PubMed

Publication types

MeSH terms