

Systematic regional variations of GABA, glutamine, and glutamate concentrations follow receptor fingerprints of human cingulate cortex
- PMID: 23904606
- PMCID: PMC6618546
- DOI: 10.1523/JNEUROSCI.1758-13.2013
Systematic regional variations of GABA, glutamine, and glutamate concentrations follow receptor fingerprints of human cingulate cortex
Abstract
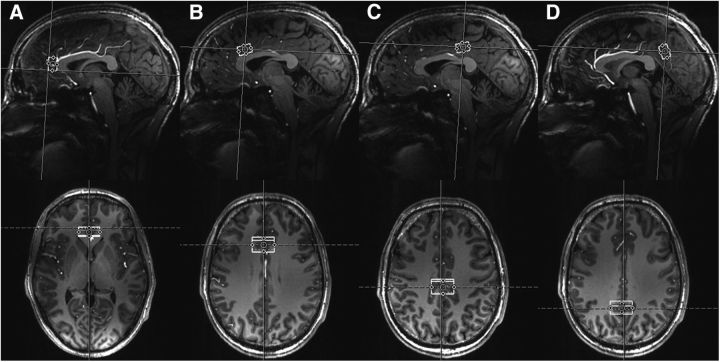
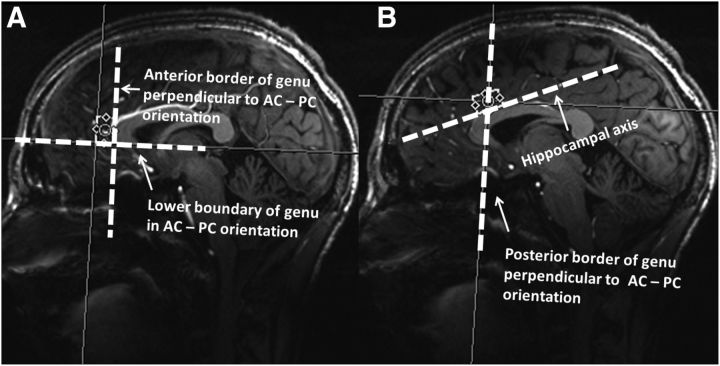
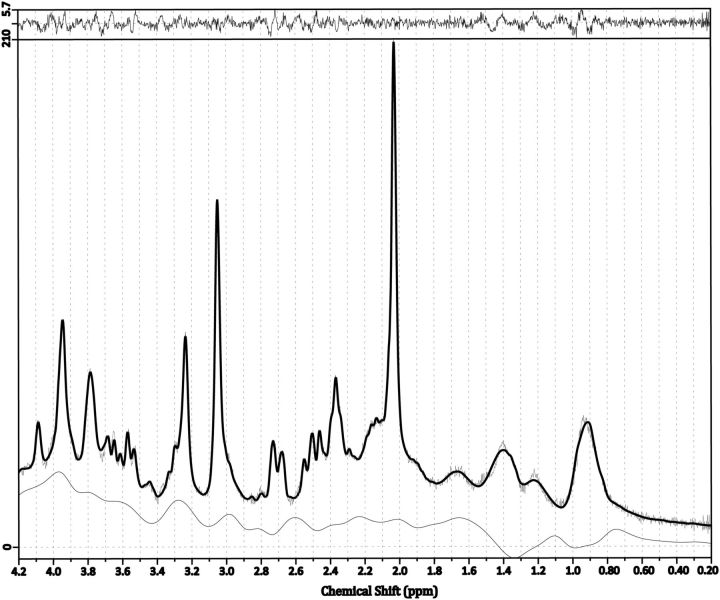
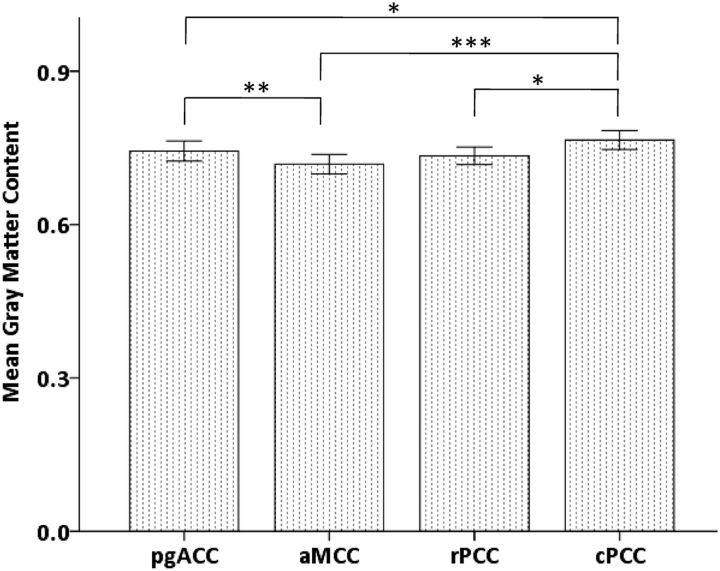
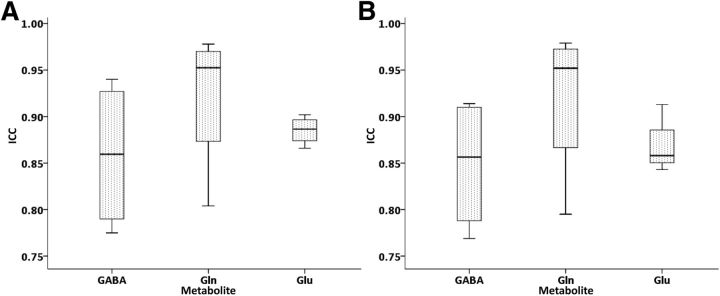
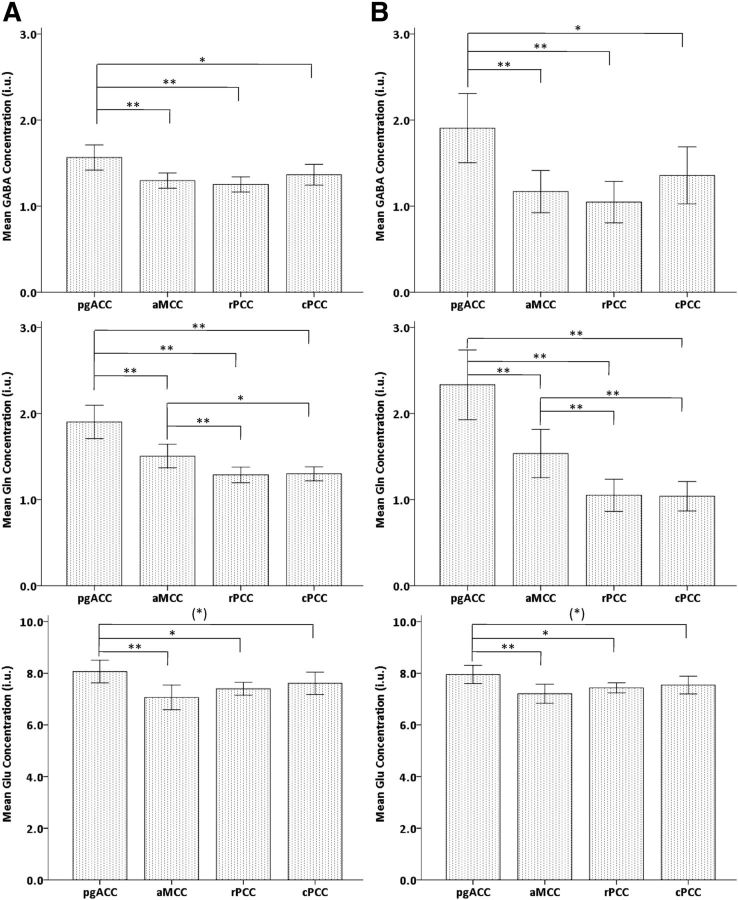
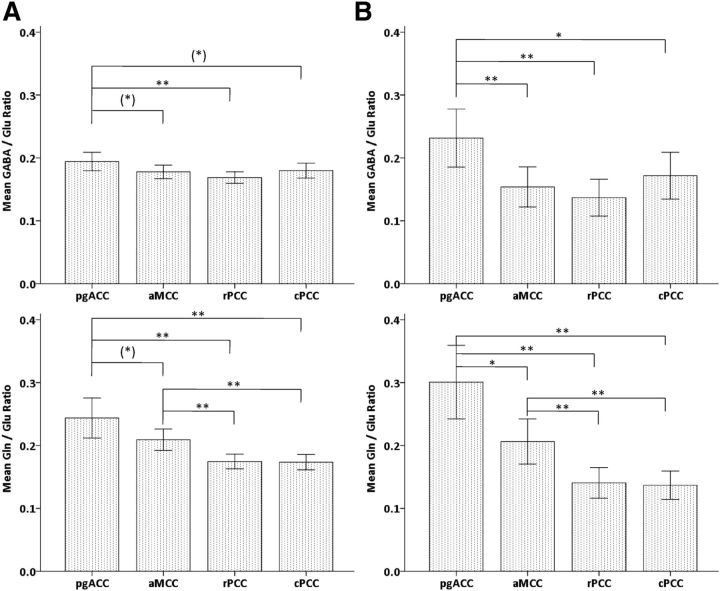
Magnetic resonance spectroscopy (MRS) of glutamatergic or GABAergic measures in anterior cingulate cortex (ACC) was found altered in psychiatric disorders and predictive of interindividual variations of functional responses in healthy populations. Several ACC subregions have been parcellated into receptor-architectonically different portions with heterogeneous fingerprints for excitatory and inhibitory receptors. Similarly, these subregions overlap with functionally distinct regions showing opposed signal changes toward stimulation or resting conditions. We therefore investigated whether receptor-architectonical and functional segregation of the cingulate cortex in humans was also reflected in its local concentrations of glutamate (Glu), glutamine (Gln), and GABA. To accomplish a multiregion estimation of all three metabolites in one robust and reliable session, we used an optimized 7T-stimulated echo-acquisition mode method with variable-rate selective excitation pulses. Our results demonstrated that, ensuring high data retest reliability, four cingulate subregions discerning e.g., pregenual ACC (pgACC) from anterior mid-cingulate cortex showed different metabolite concentrations and ratios reflective of regionally specific inhibition/excitation balance. These findings could be controlled for potential influences of local gray matter variations or MRS voxel-placement deviations. Pregenual ACC was found to have significantly higher GABA and Glu concentrations than other regions. This pattern was not paralleled by Gln concentrations, which for both absolute and relative values showed a rostrocaudal gradient with highest values in pgACC. Increased excitatory Glu and inhibitory GABA in pgACC were shown to follow a regional segregation agreeing with recently shown receptor-architectonic GABAB receptor distribution in ACC, whereas Gln distribution followed a pattern of AMPA receptors.
Figures
References
-
- Brennan BP, Hudson JI, Jensen JE, McCarthy J, Roberts JL, Prescot AP, Cohen BM, Pope HG, Jr, Renshaw PF, Ongür D. Rapid enhancement of glutamatergic neurotransmission in bipolar depression following treatment with riluzole. Neuropsychopharmacology. 2010;35:834–846. doi: 10.1038/npp.2009.191. - DOI - PMC - PubMed
Publication types
MeSH terms
Substances
LinkOut - more resources
Full Text Sources
Other Literature Sources